icon

How to Prepare Your Sales Department for Implementing Automated Sales Analytics

Many leaders want to see accurate reports on sales, conversion, and revenue forecasts. But when it comes to implementing automated sales analytics, the CRM turns out to be a mess. Managers fill in fields however they feel like, funnel stages don’t reflect the real process of working with a client, and half the information lives in spreadsheets and social media chats.

Want a high-performing sales team without the hassle?
We’ll build it for you.

Contact Us

Key Takeaways

  • Beautiful dashboards built on incorrect data show a distorted picture – the problem isn’t the BI tool, it’s the chaos inside your CRM and the lack of unified rules for working in it.
  • Managers need to have the same understanding of when to create a deal and when to change its stage and status, otherwise one manager’s conversion rate will simply look higher due to different approaches to working with the CRM.
  • Mandatory fields (source, reason for rejection, customer segmentation, probability of closing) turn analytics from a toy into a management tool – without them, it’s impossible to calculate channel ROI or understand where you’re losing customers.
  • Integrating the CRM with your website, ads, telephony, and payments closes the gap between a lead, a call, and a payment – that’s the only way to build true end-to-end analytics.
  • A regular rhythm of plan-vs-actual analysis (daily leads, weekly funnel review, monthly ROI) makes data the foundation of decisions, not just decoration for presentations.

In the article below, you’ll find a step-by-step algorithm for preparing your sales department, setting up your CRM, and implementing metrics so that automated sales analytics actually works 👇

The result is predictable: dashboards show beautiful charts, but the leader can’t understand what’s actually happening. The problem isn’t the analytics tools – it’s the preparation. Sales analytics automation doesn’t start with Power BI, Tableau, or Data Studio – it starts with putting things in order in the sales department, the CRM system, and the rules for working with data.

What Is Sales Analytics Automation?

Sales analytics automation is the use of specialized tools and algorithms to collect, process, analyze, and visualize sales data without constant human involvement. This approach minimizes manual work, reduces the likelihood of errors, and speeds up management insights.

The process includes four main stages: automatically collecting the necessary data from CRM, ERP, and e-commerce platforms, cleaning and standardizing it, analyzing it using statistical methods, and finally visualizing it as dashboards and reports. Modern systems use machine learning to find hidden patterns in customer behavior and forecast demand. If you’d like to learn more about applying modern approaches, check out forecasting and machine learning in sales, which help uncover new growth opportunities.

Does it sound familiar – beautiful dashboards showing great numbers, but real sales aren’t growing? Or a CRM full of data, but it’s impossible to make a management decision based on it? This is the classic situation that 90% of companies face when implementing sales analytics on their own.

At “Rocket Sales,” over 8+ years, we’ve developed a systematic approach to preparing sales departments for automated sales analytics. Our experts carry out a full systematization of processes: from CRM audits and funnel setup to implementing KPI dashboards and training the team to work with data. We don’t just build reports – we create a working analytics ecosystem where every metric is tied to specific management decisions.

Over the years, we’ve helped more than 200 companies turn CRM chaos into a clear control system, allowing our clients to increase revenue by up to +35% simply through proper analytics work.

Turn your data into a sales growth tool - get a comprehensive systematization of your sales department!

Tech giants like Amazon have long used predictive analytics to forecast purchases. Their algorithms analyze order history, seasonality, on-site user behavior, and even external factors like weather to generate “Customers also bought” recommendations. Behind this are complex machine learning models, but the principle can be adapted for any business. The key is having high-quality source data to train the algorithms.

Benefits of Sales Analytics Automation

Implementing analytics in the sales department significantly affects the quality and speed of decision-making. Companies gain concrete benefits that directly show up in financial performance.

The first and most obvious benefit is time savings. Leaders stop wasting hours collecting data from various sources and manually building reports. Tasks that used to take a full day are now solved in minutes. This frees up resources for analysis and decision-making rather than technical work.

Scalability becomes especially important as the business grows. An automated system easily handles increasing data volumes – whether it’s growth in the number of customers, deals, or sales geography. Human resources for processing information grow linearly, while technology performance grows exponentially.

Data accuracy is another critical factor. Automated systems eliminate human error in transferring information, calculating metrics, and generating reports. This is especially important for companies with large volumes of data, where even a small percentage of errors can distort the whole picture.

  • Real-time analysis access lets you respond quickly to market changes
  • Actionable insights by identifying patterns and “bottlenecks” in the sales process
  • Automatic detection of anomalies and trends that are hard to spot with manual analysis
  • The ability to A/B test sales strategies based on accurate data
  • Integration with marketing channels for end-to-end analytics from lead to sale

You can learn more about visualization tools and implementing analytics from our material on sales department analytics and dashboards.

Why You Can't Implement Analytics Without Preparing Your Sales Department

Automated analytics only works on the basis of quality data. If managers don’t promptly update deal stages and statuses, don’t specify lead sources, and don’t fill in reasons for rejection, reports will show a distorted picture.

Many leaders think analytics will automatically fix the chaos in their data. In practice, it’s the opposite – automation makes problems more visible. When a dashboard shows that 40% of deals have been stuck at the “negotiations” stage for six months, it becomes obvious: managers aren’t running the funnel correctly.

Without preparing processes, a company risks getting an expensive system that generates beautiful but useless reports. The leader sees growth charts, while in reality sales are falling – the CRM data simply doesn’t reflect reality. That’s why, before implementing analytics, you need to get your CRM in order, train your team, and implement data-handling rules. Only then will automation become a management tool instead of an expensive toy.

Step 1. Define Which Management Questions Analytics Should Answer

Preparing for automation starts with a clear understanding of goals. The leader should draw up a list of specific questions they want answered: how many leads come through each channel, which sources actually generate sales, at what stages deals are lost, and which managers are showing the best results.

It’s also important to define operational needs: how much money is in the pipeline, what’s the revenue forecast for the month or quarter, why customers decline to buy, and what’s the average deal cycle by customer type. These questions will form the basis for CRM setup and metric selection.

Without a clear list of management tasks, a company risks setting up dozens of reports that no one uses. Analytics should solve specific business problems, not just collect all available data. So the first step is to fix which decisions the leader will make based on data and how often they need updated information. This forms the foundation for the entire analytics architecture.

Step 2. Review Your Current Sales Funnel

The stages of your CRM funnel should reflect the customer’s real journey from first contact to closing the deal. A typical B2B funnel includes: new lead, qualified, consultation or presentation completed, proposal presented, contract signed, payment received. Each stage should have clear transition criteria.

Problems arise when stages are named abstractly or duplicate each other. For example, “lead processing” and “initial contact” essentially mean the same thing. Or when managers use stages differently: one moves a deal to “negotiations” after the first call, another only after sending a proposal.

If the funnel isn’t standardized, automated analytics won’t be able to correctly calculate conversion between stages or show exactly where customers are being lost. That’s why, before implementing analytics, you need to revisit the funnel, bring stage names to a unified logic, and describe clear rules for transitioning between them. Only then will conversion reports reflect an accurate picture of sales effectiveness.

Step 3. Preparing the CRM for Analytics

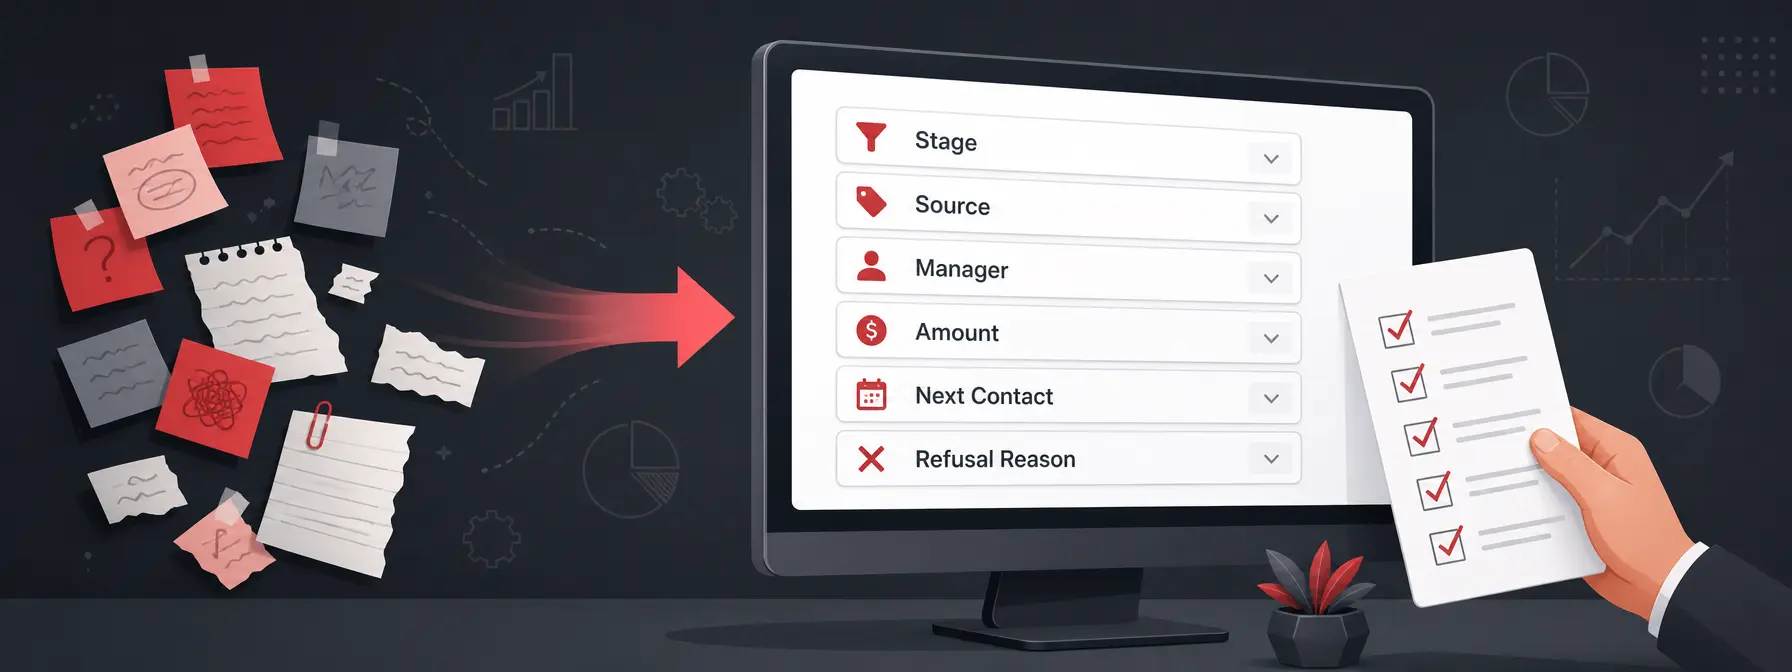
Preparing the CRM for analytics requires configuring the set of fields that will serve as the data source for reports. Mandatory, up-to-date fields should include lead source, deal status, responsible manager, funnel stage, deal amount, next contact date, reason for rejection, and customer type.

Every field should have preset selection options to prevent arbitrary entries. For example, lead sources: “website,” “Google Ads,” “Facebook Ads,” “cold calls,” “referrals,” “trade show.” Reasons for rejection: “price too high,” “solution doesn’t fit,” “no budget,” “bought from a competitor,” “decision postponed.”

The CRM should become the single source of truth about sales. If part of the information is stored in Excel spreadsheets, part in Telegram chats, and part in task comments, automated sales analytics will be incomplete. All data about customers, deals, and manager activity should be recorded in structured form within the CRM.

It’s also important to set up automatic notifications and tasks. The system should remind managers to update a deal’s status, schedule the next contact, or fill in a rejection reason. Without such mechanisms, CRM discipline quickly declines. The result of this preparation: the CRM becomes an accurate reflection of the real sales process, suitable for automated analysis.

For more on the practical aspects of sales reporting automation, check out our material – it contains plenty of recommendations on setting up data sources and field systems.

preparing CRM for analytics — Illustration of organized mandatory CRM fields for analytics

Step 4. Define Mandatory Data for Each Deal

For analytics to work correctly, every deal must contain a minimum set of mandatory data. Lead source shows where the customer came from – this is the basis for calculating acquisition cost and ad channel ROI. The date and time the lead came in is needed to analyze processing speed and time-based conversion.

Responsible manager, deal stage, and amount are basic fields for all funnel and team performance reports. Probability of closing helps build sales forecasts, and the next planned step shows whether the manager is actively working with the customer or the deal is “frozen.”

Also mandatory should be the reason for rejection for lost deals, customer type (new/returning, B2B/B2C), product or service, date of last contact, and the customer’s planned decision date. This data allows for segmented analysis and identifying patterns.

Without fully filling in key fields, a leader won’t be able to understand what’s really happening with sales. For example, if the lead source isn’t specified, it’s impossible to assess marketing effectiveness. If the rejection reason isn’t filled in, it’s hard to understand why customers are being lost. That’s why mandatory fields aren’t bureaucracy – they’re a necessary condition for analytics to work.

Step 5. Set Unified CRM Rules for Managers

Managers need to have the same understanding of when to create a deal, when to change the funnel stage, what counts as a qualified lead, and how to record negotiation results. Without unified rules, one manager creates a deal after any inbound call, while another does so only after identifying need and budget.

Rules should describe specific actions for each stage. For example, moving to the “proposal presented” stage should only be possible after filling in fields for the customer’s budget, decision timeline, and decision-maker contacts. Closing a deal as lost requires mandatory specification of the reason and scheduling a follow-up task after a certain period.

It’s also important to standardize the initial lead-processing process. A manager should contact a new lead within a set time frame, qualify it using a checklist, fill in the customer card, and schedule the next step. All of this should be reflected in the CRM automatically or through mandatory fields.

Without unified rules, analytics will show a distorted picture. That’s why, before launching automated sales analytics, you need to describe work standards and train the entire team.

Step 6. Check the Quality of Historical Data

Before launching analytics, you need to audit the data accumulated in the CRM. Typical problems include: duplicate contacts and companies, deals without a specified amount or owner, old open deals with no activity, incorrect lead sources, and empty rejection-reason fields.

There are also systemic errors: outdated contact and company statuses, deals in the wrong currency, incorrect creation or closing dates. All of this distorts metric calculations and can lead to incorrect conclusions when analyzing trends.

Historical data can only be used to build baseline metrics after cleaning and standardization. If chaos has accumulated in the CRM over several years, it’s better to first put active deals and key fields in order, and build historical analysis gradually as quality data accumulates under the new system.

The cleanup process includes removing or merging duplicates, standardizing reference lists (sources, rejection reasons, customer types), filling in critically important empty fields, and closing out irrelevant deals. After that, analytics will be able to work correctly with current data and gradually incorporate historical data to identify long-term trends.

Step 7. Connect the CRM to Data Sources

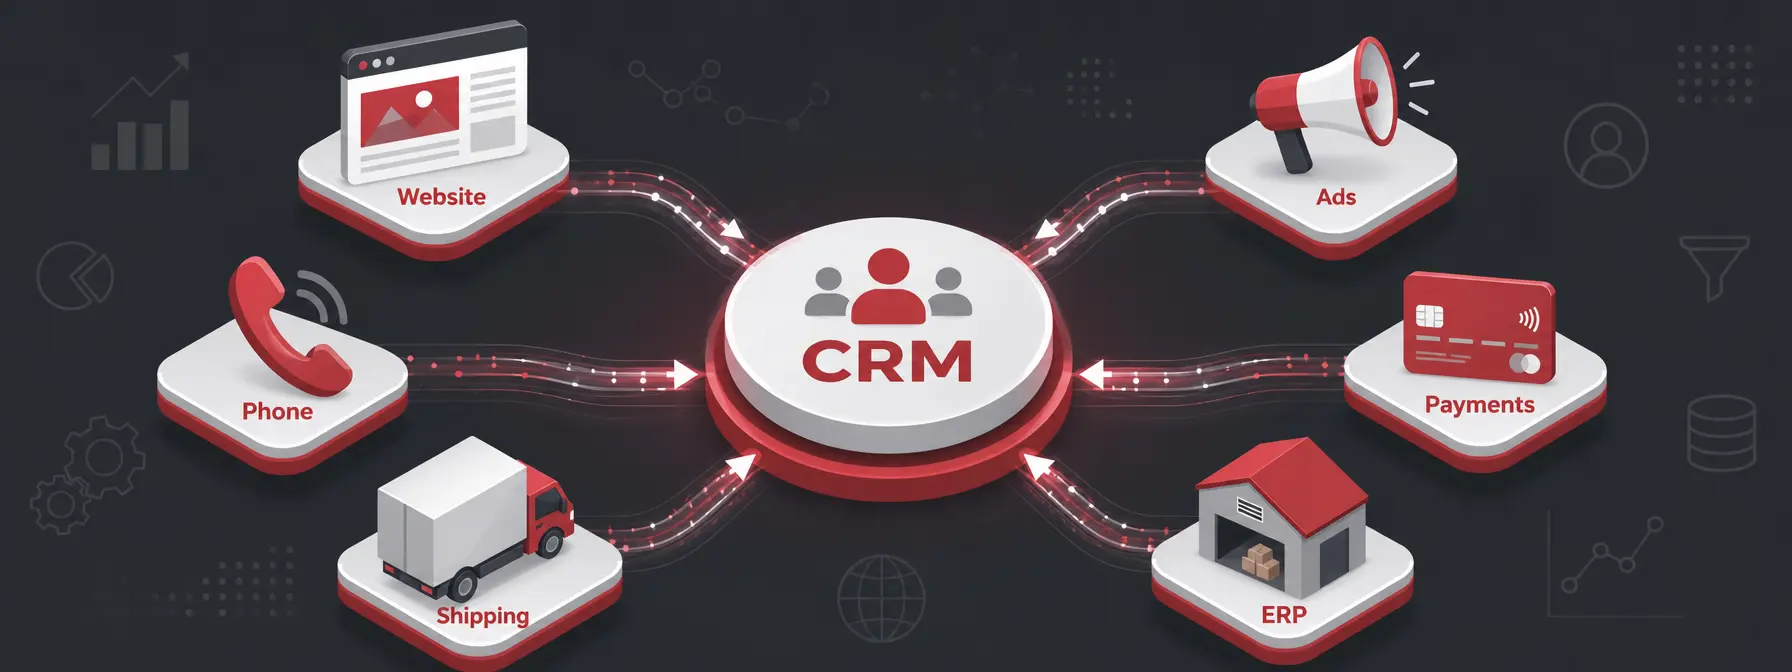
Automated sales analytics often requires integrating the CRM with external data sources. The website and lead forms should automatically pass along leads with source and UTM tags. Google and Facebook ad accounts are needed to link ad spend with the leads and sales generated.

Telephony integration allows you to automatically record calls, their duration, and call recordings. Connecting messengers and email helps track all customer communication in a single interface. Call tracking links phone leads to traffic sources.

For a complete picture, you also need integrations with payment systems (to automatically close paid deals), delivery services (to track order fulfillment), and your ERP system (to link sales with inventory levels and cost of goods).

Without connected data, a company only gets a fragmented picture of the funnel. For example, a lead might come from an ad, the call gets recorded in telephony, the deal lives in the CRM, and the payment shows up in the bank. To build end-to-end ROI analytics, these points need to be automatically linked through unified customer or deal identifiers.

Learn more about where to start with CRM implementation for sales growth and integrating external sources in a separate article by our experts.

CRM integration with data sources — Diagram of CRM integration with external data sources

Step 8. Define Key Sales Department Metrics

After setting up processes and integrations, you need to choose the metrics that will be tracked in automated analytics. Basic metrics include the number of leads by source and period, conversion at each funnel stage, cost per lead, lead-to-sale conversion, average deal size, and total revenue.

For team management, activity metrics matter: number of calls, meetings, and proposals sent per manager, speed of processing new leads, and sales plan fulfillment. It’s also worth tracking the amount of money in the pipeline (total of active deals), sales forecasts based on closing probabilities, and average deal cycle length.

Analytical metrics help identify problems: main reasons for customer rejection, effectiveness of various lead sources by conversion and cost, sales seasonality, and average deal size growth dynamics. Operational metrics monitor discipline: the share of overdue tasks, number of deals with no activity, and the percentage of mandatory fields filled in. The set of metrics should match the specifics of the business.

  • Number of leads by channel and conversion by funnel stage
  • Cost per lead, conversion to deal, and average deal size by source
  • Revenue, money in the pipeline, and sales forecast broken down by manager
  • Deal cycle length and team activity (calls, meetings)
  • Lead processing speed and sales plan fulfillment
  • Rejection reasons, source effectiveness, and share of overdue tasks

Step 9. Prepare Your Team to Work With Analytics

Implementing automated analytics often meets resistance from managers who see the new reports as extra oversight. It’s important to explain the practical benefits: analytics will help identify funnel problems faster, get higher-quality leads, fairly evaluate work results, and hit sales targets.

Training should include not just technical work with the CRM, but also an understanding of the business logic. Managers should know how their actions affect reports, why it’s important to fill in certain fields, and how the leader will use the data to make decisions about budgets, bonuses, and team development.

It’s helpful to show examples of successful analytics use: how data helped identify the best lead sources, optimize sales scripts, or redistribute effort among customer segments. When the team sees concrete benefits from maintaining the CRM, resistance decreases.

It’s also necessary to set up regular feedback: weekly reviews of each manager’s metrics, discussion of problems and successes, and adjusting processes based on data. Analytics should become a tool for team development, not just oversight.

Step 10. Set Up Dashboards for Different Roles

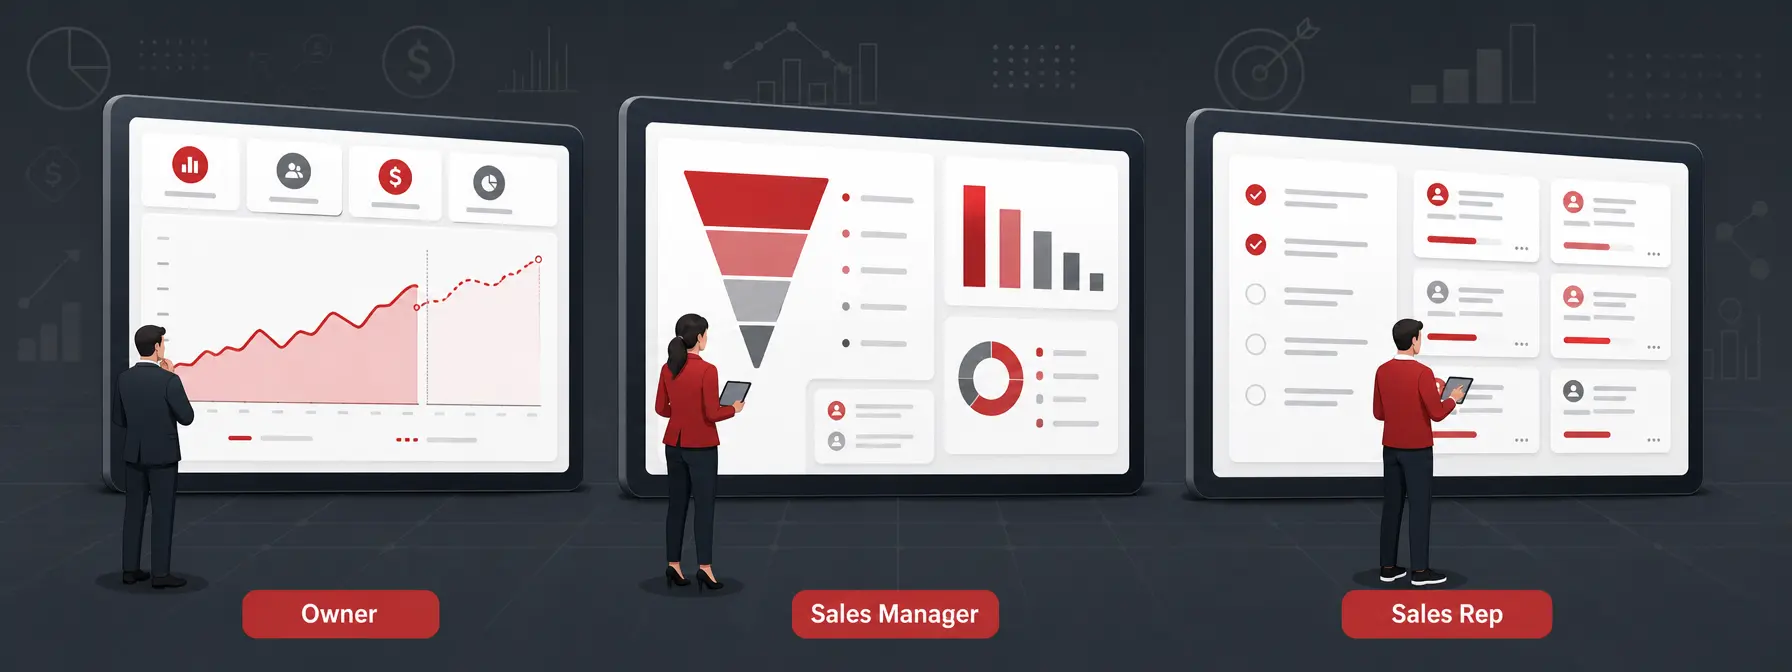
Different roles within the company need different analytics. The business owner needs strategic metrics: total revenue, quarterly forecast, marketing channel ROI, growth dynamics, and comparison against plan. Details on individual deals or managers are excessive at this level.

The sales manager focuses on operational metrics: conversion by funnel stage, activity and results of each rep, main rejection reasons, and deal cycles. They need detail for making tactical decisions and managing the team.

The sales rep works with personal metrics: plan fulfillment, active deals, overdue tasks, next steps with customers, and personal funnel. Access to colleagues’ data usually isn’t required, but it’s useful to see overall team metrics for motivation.

If one dashboard tries to meet the needs of every role, it becomes overloaded and hard to use. It’s better to create specialized reports for specific management tasks: daily monitoring of new leads, weekly funnel analysis, monthly revenue reports. Everyone should see exactly what they need for their job.

dashboards for sales roles — Personalized dashboards for different sales roles

Step 11. Establish a Regular Rhythm of Data Analysis

Automated sales analytics is useless if dashboards are created but no one uses them. You need to build data work into regular management processes: daily checks of new lead processing speed and the number of overdue tasks, weekly funnel conversion reviews, and monthly analysis of revenue and channel effectiveness.

It’s important to define who will analyze reports, when, and how. A leader might check incoming leads and their processing speed daily at 9 AM, hold a Friday meeting to review each manager’s metrics, and analyze plan fulfillment and marketing ROI at the end of the month.

Analytics should become the basis for one-on-one meetings with managers, budget planning, and adjusting customer acquisition strategy. Data from the CRM and dashboards should be used when making decisions about hiring, training, and changing sales processes.

A regular analytics rhythm builds a culture of data-driven decision-making rather than intuition. When the team sees that the leader is genuinely using reports for management, CRM data quality automatically improves.

Mistakes When Implementing Sales Analytics Automation

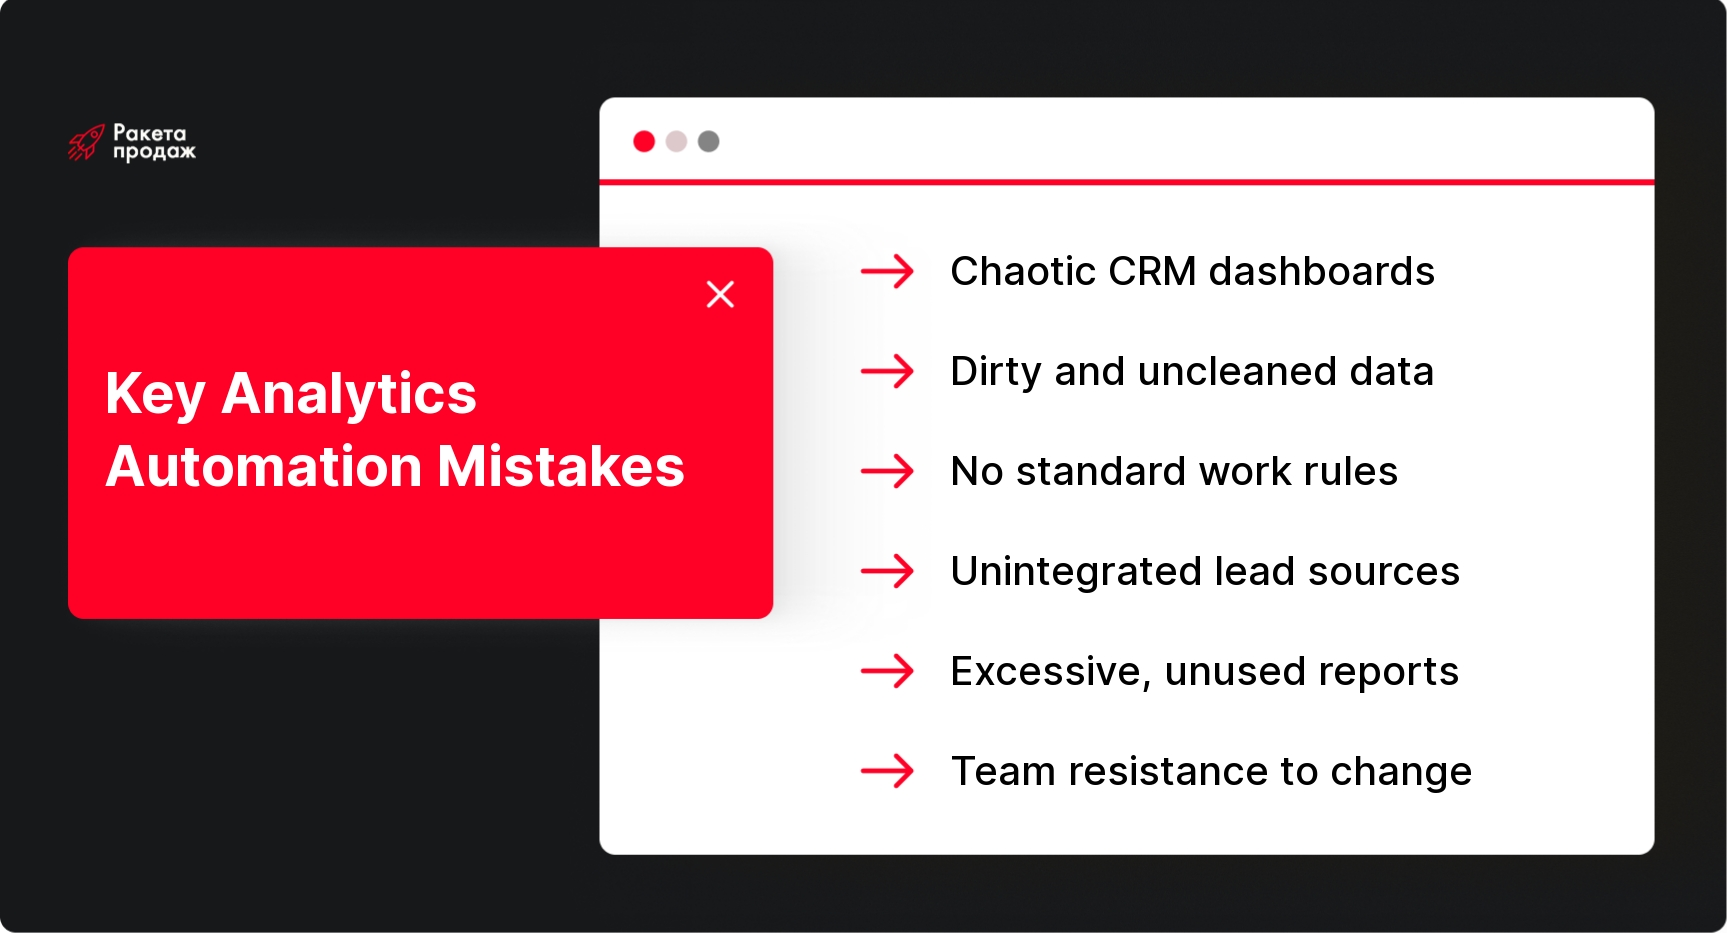
Most companies make the same mistakes when implementing sales analytics. The biggest one is starting with tools instead of processes. They buy a Power BI license, hire an analyst, build beautiful dashboards, and then discover that the CRM data is poor quality.

The second common mistake is ignoring the cleanup of historical data. As a result, analytics shows trends based on “dirty” data, and the conclusions turn out wrong. The third problem is the lack of unified CRM rules. Managers understand funnel stages differently and don’t fill in all the necessary fields, so reports distort the real picture.

Technical mistakes are also common: lead sources aren’t automatically passed from ads into the CRM, there’s no rejection-reason reference list, and dashboards are overloaded with excessive metrics. Organizational problems include a lack of regular data analysis and unrealistic expectations – the owner wants accurate forecasts from chaotic source data.

  • Starting with dashboards without first getting processes and the CRM in order
  • Not cleaning historical data or standardizing reference lists
  • Managers filling in the same fields differently due to lack of rules
  • Lead sources not integrated, rejection reasons not structured
  • Reports overloaded with metrics and not used in management
  • The team doesn’t understand the value of analytics and resists change

Main takeaway: technology doesn’t fix bad processes – it just makes the problems more visible.

Preparing a sales department for automated sales analytics isn’t a one-time task – it’s a comprehensive transformation of all your data processes. Applying the principles described in this article will significantly improve your analytics quality, but for guaranteed results, it’s worth trusting the experts.

“Rocket Sales” specializes in building complete, turnkey sales analytics systems: we conduct a deep CRM audit, standardize processes, integrate data sources, and create personalized dashboards for every role in the company. Our methodology includes not just technical setup, but also team training, implementing regular data analysis rhythms, and building a fact-based decision-making culture.

As a result of our work, our clients see conversion gains of up to 86% and revenue increases of up to +35% thanks to properly configured analytics.

Our clients include companies like Mitsubishi, Audi, and Naftogaz.

Build a sales department with transparent analytics and predictable results!

Conclusions

image

How to Implement Automated Analytics in a sales department is a complex question that requires a systematic approach. It’s not about buying a BI system and building charts. It’s a comprehensive transformation that starts with putting the CRM, processes, and team discipline in order. If managers work by unified rules, fill in mandatory fields, and data sources are integrated, analytics becomes a powerful management tool. Otherwise, the company ends up with expensive dashboards showing beautiful but useless reports. The quality of analytics depends directly on the quality of preparation: the better a company prepares its processes, CRM, and team, the more value sales analytics automation will deliver.

In this article:
See more
Book a FREE sales funnel audit
CONTACT US
FAQ
What data is needed for sales analytics automation?

The mandatory minimum: source, responsible manager, funnel stage, deal amount, creation date, closing date, rejection reason, and customer type. Integrations with telephony, ad accounts, and payment systems are also very useful.

Why might automated analytics show incorrect data?

The main reasons: poor-quality source data in the CRM, lack of unified rules for managing deals, non-integrated lead sources, unfilled mandatory fields, and duplicate records. Analytics reflects the quality of your data – it doesn’t fix it.

How do you prepare managers for automated sales analytics?

Explain the practical benefits, train them on CRM rules, show them how their work affects reports, implement regular metric reviews, and use the data for fair performance evaluation and team development.

How do you know if a sales department is ready for automated sales analytics?

Key criteria: CRM deal cards are filled in regularly, funnel stages are standardized, mandatory fields are completed, the team understands the rules for working with data, lead sources are integrated, and there’s a plan for using analytics in management.

SUBSCRIBE TO MY TELEGRAM CHANNEL
The most valuable sales information right on your phone!
icon

LOTS OF USEFUL INFORMATION, FREE TEMPLATES, AND CHECKLISTS ON MY INSTAGRAM

Materials and practical advice on sales growth in our blog: