icon

How Automated Reports Help You Spot Sales Dips Faster

In a sales department, dips often become visible far too late – once the plan has already been blown, revenue has dropped, or a mountain of lost deals has piled up. The manager sees the final number but doesn’t understand exactly where the problem originated. Maybe there were fewer leads? Or reps are processing requests more slowly? Or maybe the issue lies in the quality of negotiations or the approval stage?

Want a high-performing sales team without the hassle?
We’ll build it for you.

Contact Us

Key Takeaways

  • Manual reporting shows the problem only after the fact, while automation shrinks the gap between a dip occurring and it being detected.
  • Operational metrics dip first (processing speed, activity, follow-up), then conversion drops, and only after that does revenue collapse.
  • A funnel report pinpoints the problem with surgical precision: a drop after a meeting points to weak needs diagnosis, a drop after sending a proposal points to price or lack of touchpoints.
  • Alerts triggered the moment a deviation occurs (a lead not processed within 15 minutes, a deal stalling, channel conversion dropping by 30%) turn management into rapid emergency response.
  • A forecast based on the current state of the funnel and closing probability lets you spot the risk of missing the plan mid-month and take action before it fails.

In the article below, you’ll find the specific reports you need to set up, which metrics to track, and how to use notifications to catch dips before your competitors do 👇

Automated reports solve this puzzle. They show not just the result, but the entire movement of the funnel in real time. Data updates regularly, and you see deviations before they turn into a serious problem. Instead of waiting until the end of the month and being surprised by low numbers, you get an early warning about risks. To learn more about the specific benefits of automatic sales reports that companies get, check out our website.

Have you ever run into a situation where problems in your sales department only become visible at the end of the month, once the plan is already blown? Where you see the final numbers but don’t understand exactly where the breakdown happened – in lead quality, rep performance, or at some stage of the funnel? This is a typical situation for 80% of companies that manage sales “blindly.”

At “Rocket Sales,” over 8+ years of work, we’ve built a systematic approach to reporting automation and sales analytics. We implement comprehensive dashboards, configure CRM systems, and create automatic sales reports that reveal problems in real time, not at the end of a period. Using our methodology, we’ve built 208 sales departments across various niches – from IT to manufacturing.

Our clients get full visibility into the sales funnel and can make management decisions based on accurate data instead of guesswork.

Build a system that reveals sales problems before they impact your results - get a transparent sales department with a +35% revenue increase!

Why Manual Reporting Gets in the Way of Finding Problems Quickly

Manual reporting is like driving a car while only looking in the rearview mirror. Reps spend hours filling out spreadsheets across different files or systems, data gets collected with delays, and numbers in various files don’t match the CRM. Reports depend on employee discipline – forget to log a call or meeting, and the whole picture becomes distorted.

But the main problem isn’t the labor involved – it’s reaction speed. With manual reporting, the manager sees the problem only after the fact. Sales dropped – but it’s unclear whether there were fewer leads, conversion got worse, or reps are simply working more slowly. While you’re figuring out the causes, competitors are already taking your customers.

Reporting automation drastically shrinks the gap between a problem and its detection. Now deviations are visible not a week later, but a day or even an hour after they appear. Modern reporting automation systems allow you to shift from retrospective analysis to proactive management. One of the key factors behind this approach’s effectiveness is choosing the right key metrics for a sales department to track in your reports.

What Kinds of Sales Dips Can You Spot Through Automatic Reports

Automatic reports work like an early-warning system for your business. They reveal problems at every level of the funnel, from entry to payment. Fewer new leads coming in? The system flags it right away. Longer time to first contact or a growing pile of unprocessed requests? That’s visible immediately too.

What’s especially valuable is that automatic sales reports show not just the final revenue, but also early signals of upcoming dips. If conversion drops at a specific funnel stage, if there are fewer meetings or demos, if reps are doing fewer activities – all of these are warning signs of a sales decline a few weeks down the road.

Common dips that get caught quickly include: a growing share of a particular rejection reason, a longer deal cycle, a lead source with sagging conversion, dropping conversion for a specific rep, and a sales plan forecast under 100%. The system helps you pinpoint the problem precisely and fast.

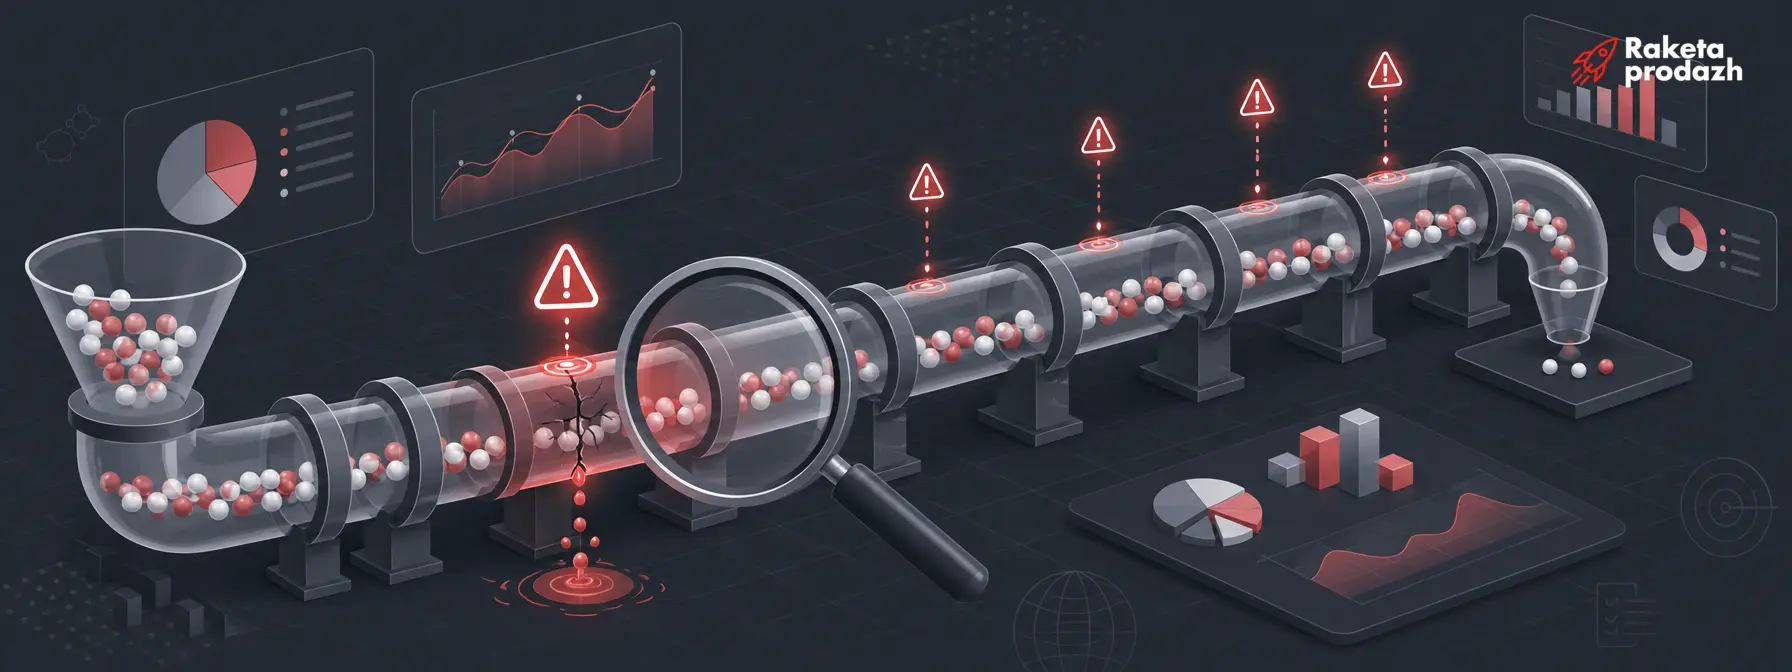
sales drops — Analytics dashboard with a leak in the sales pipeline symbolizing early warning signals

How Reporting Automation Helps You Spot Problems Earlier

Imagine having a medical device that monitors your health in real time. Automated reports work on the same principle for your sales department. They let you track key metrics regularly and in real time, instead of waiting for a “diagnosis” at the end of the month.

The early-diagnosis principle is simple: operational metrics change first, then conversion drops, and only after that does revenue decline. If the funnel starts sagging at the qualification stage, if reps have stopped doing follow-up, if the number of overdue tasks has grown – the manager sees it early and can take action.

This fundamentally shifts the approach to sales management: from reactive to proactive. Instead of fixing consequences, you prevent problems at the root. If you want to know how to quickly identify sales issues, reporting automation is your main tool.

Lead Report: How to Spot That the Problem Is Starting at the Top of the Funnel

The lead report is your “barometer” for future sales. It shows the number of new leads, their sources, cost per lead, share of qualified leads, processing speed, and the percentage of unprocessed requests. This data updates automatically, rather than being handed over once a month.

The special value of this report is that it helps predict the future. If there are fewer leads, or their quality has dropped, sales will dip within a few weeks. But thanks to the automated report, you see the problem at the entry point of the funnel and can give timely feedback to marketing or qualifiers.

For example, if conversion from social media leads dropped from 15% to 8%, while contextual advertising held steady at 22%, the problem isn’t with the reps – it’s with traffic quality. This kind of insight lets you quickly reallocate budget between channels. To track these moments precisely, it’s worth using sales department analytics and dashboards that let you visualize all lead dynamics.

Processing Speed Report: How to Find Lost Requests

Response speed is oxygen for a sales department. If reps reach out to customers too late, some leads go cold or head to competitors. An automated processing-speed report shows time to first contact, overdue tasks, leads with no owner assigned, and requests stuck in “new lead” status for too long.

This report matters especially because it reveals not just big systemic dips, but everyday operational losses too. A lead came in at 2:00 PM, but the rep didn’t reach out until 6:00 PM? That’s already a 20-30% hit to conversion. A missed call with no callback? Another lost opportunity.

Automatic notifications make control even more effective: the system reminds you about overdue tasks, leads with no next step scheduled, or requests that have stalled with no movement. Nothing falls into the “black holes” between Excel files anymore. An evolutionary next step here is CRM implementation, so that all these reports get integrated into your workflows without any data loss.

Funnel Report: How to See Exactly Where Conversion Drops

The funnel report is an X-ray of your sales process. It shows deals moving through stages: new lead, qualified, meeting held, proposal sent, negotiations, invoice issued, payment received. Each stage has its own conversion rate, and the automated system tracks changes in the dynamics.

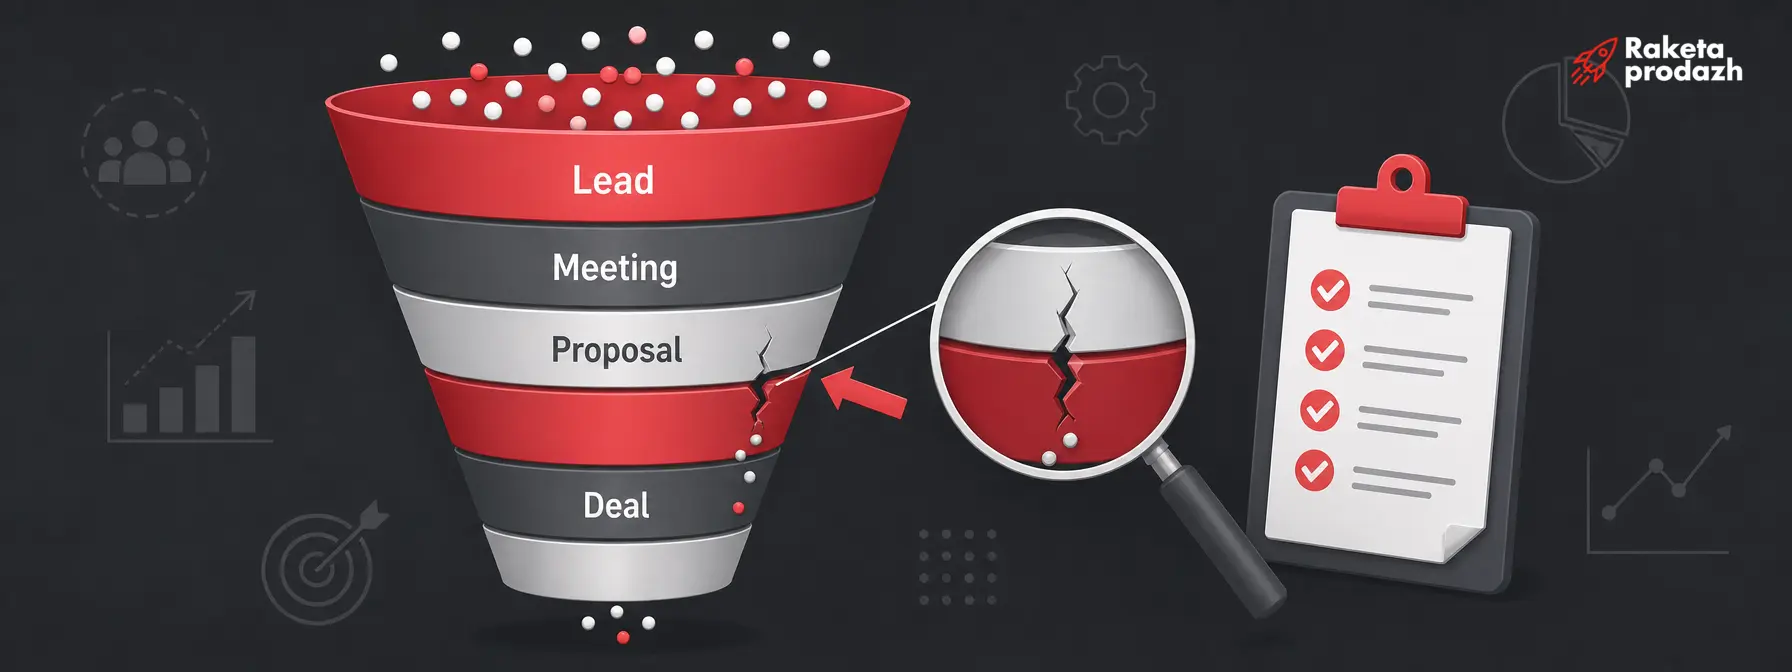
The beauty of this report is that it helps pinpoint the problem with surgical precision. A drop from lead to qualification usually points to poor lead quality or incorrect prioritization when working new leads from different sources. A drop after a meeting has been held points to weak needs diagnosis or a subpar presentation. A drop after a proposal has been sent is often tied to price, undelivered value in the offer, or a lack of follow-up.

An automated funnel report lets you discuss sales not “in general,” but in terms of specific bottlenecks. A rep says, “Customers just aren’t buying”? The report shows: conversion from meeting held to proposal sent dropped from 60% to 35%. Now you know exactly what to work on. Additionally, for a deep dive into deal structure and identifying weak points, a professional sales funnel analysis is ideal – it will reveal systemic deviations and growth zones.

sales funnel report — Sales funnel diagram with labeled stages and a highlighted conversion drop point

Rep Activity Report: How to Tell a Demand Problem from a Team Performance Problem

A sales dip isn’t always about the market or marketing. Sometimes the reason is simpler – reps have just become less active. Fewer calls, emails, meetings, and follow-up touches on open deals. An automated activity report helps you quickly separate external factors from internal ones.

The report can track the number of activities, share of completed tasks, overdue follow-ups, number of meetings, repeat touches, and deals with no activity. The key is to connect activity to results. If leads are there but rep activity is falling, that’s a management problem, not a market problem.

A properly configured report doesn’t encourage “activity for activity’s sake.” What matters isn’t just calls, but calls that lead to qualification. Not just meetings, but meetings after which a proposal gets sent. An automated system helps you find the right balance between quantity and quality of activity.

Rep-by-Rep Report: How to Spot Individual Dips

Automated reports let you compare reps not just by revenue, but by intermediate metrics as well. Lead processing speed, conversion by stage, average deal size, number of activities, deal cycle, and rejection reasons by share – all of this helps you understand who needs help, and what kind. Effective sales department analytics requires a detailed analysis of each employee’s performance, ideally done by a dedicated sales analyst.

This kind of detailed analysis uncovers interesting insights. One rep might close fewer deals but with a higher average check size. Another processes leads quickly but loses customers at the negotiation stage. A third qualifies leads well but does poor follow-up. Without automated analytics, these patterns stay invisible.

The report helps the manager pinpoint exactly who needs negotiation training, who needs help managing lead volume, and where the problem lies not with the rep but with lead quality or the difficulty of a customer segment. Management becomes personalized and effective.

Lead Source Report: How to See Where Marketing Is Falling Short

An automated lead source report is the bridge between marketing and sales. It shows not just the number of requests by channel, but their real commercial value: conversion into a qualified lead, a meeting held, a won deal, revenue, average check size, and cost per sale.

It often turns out that a channel bringing in a large number of leads generates few sales. Or the opposite – a source with a small volume of requests brings in the most expensive deals. This kind of analytics helps marketing and sales speak the same language and make decisions based on final ROI rather than intermediate metrics.

An automated report lets you spot marketing dips faster: a source might deteriorate in lead volume, lead quality, or conversion even after leads are handed off to reps. The system helps you understand where the problem lies – in channel setup, creatives, landing pages, or how incoming inquiries are handled.

Rejection Reasons Report: How to Understand Why Deals Don't Close

Tracking rejection reasons isn’t just reporting for the sake of it – it’s a source of strategic insight. An automated report can show a rise in rejections for specific reasons: too expensive, no budget, chose a competitor, no urgency, product didn’t fit, couldn’t reach the decision maker, response was too slow.

The key condition is that rejection reasons must be standardized. If reps write reasons in free text (“customer changed their mind,” “not ready,” “will think about it”), the analytics become useless. An automated system offers a list of reasons to choose from and can even require this field to be filled in.

Analyzing rejection reasons helps uncover systemic problems. If 40% of customers reject due to price, it might be time to rethink positioning or target more solvent segments. If you’re frequently losing deals due to slow response times, the problem is processing speed.

Sales Forecast Report: How to See the Risk of Missing the Plan Early

Automated reports help you assess not just sales already made, but future results too. Forecasting stops being guesswork and becomes a calculation based on real data. If the forecast is already below plan mid-month, the manager can take action early: ramp up marketing activity, boost reactivation efforts, redistribute leads among reps, speed up follow-up on key deals, or help the team with major negotiations.

Automation turns the forecast from a one-off activity at the end of the period into an ongoing process. The system shows how the forecast changes day by day, based on actuals, plan, and the number of days worked so far in the period.

How to Set Up Notifications for Critical Deviations

Automatic reports can be paired with an alert system that works like an emergency response service. Notifications arrive the moment a problem occurs: a lead hasn’t been processed within 15 minutes, a deal has stalled at a stage longer than allowed, a rep has a pile of overdue tasks, conversion has dropped below normal.

Notifications let you react not after a weekly report, but the moment a deviation appears. A rep forgot to call the customer back? The system reminds them. A lead came in after hours? The responsible employee gets a notification. Channel conversion dropped 30%? The marketer gets an immediate alert.

The key is to set up notifications sensibly, so they flag genuinely important events instead of turning into background noise. It’s better to get 2-3 critically important notifications a day than 20 minor ones that people start ignoring.

critical deviation alerts — Urgent notification system for critical sales deviations

Checklist: How to Find Dips Faster with Automated Reports

For an effective rollout of automated reports, follow this step-by-step guide:

  • Identify the key sales department metrics and areas of greatest loss
  • Set up correct funnel stages with clear transition criteria
  • Ensure high-quality CRM discipline with mandatory fields
  • Standardize and log rejection reasons
  • Plan out the data logging logic so you can track the metrics you need and gather all data in one place
  • Automate reports on leads, the funnel, reps, and sources
  • Track request processing speed and follow-up
  • Track the forecast through the end of the period based on funnel data
  • Set up notifications for critical deviations
  • Discuss reports at regular team meetings
  • Compare metrics over time, not just in absolute numbers
  • Look for the problem at the level of a specific stage, source, or rep
  • Make decisions based on data, not gut feelings or assumptions

Remember: automated reports aren’t an end in themselves – they’re a tool for faster, more precise sales management.

Automated reports aren’t just pretty charts – they’re a powerful sales management tool that can radically change your business results. But implementing quality analytics requires deep expertise: from setting up the right funnel stages to integrating your CRM with reporting systems.

“Rocket Sales” specializes in building comprehensive, turnkey analytics and reporting automation systems. We don’t just set up reporting – we build a full-fledged sales control system with KPI dashboards, automatic notifications for critical deviations, and detailed analytics for every funnel stage.

Our methodology includes analyzing current processes, configuring systems to fit your specifics, training your team, and continuous data-driven optimization. Following implementation, our clients see an average revenue increase of +35%, with our best result reaching +$10,907,403 in 4 months.

Our partners include Mitsubishi, Yamaha, Naftogaz, and other major companies. Don’t waste months experimenting with an uncertain outcome.

Turn sales chaos into a clear system with predictable growth - order your transparent sales department build right now!

Conclusion

image

Automated reports turn sales management from reactive into proactive. Instead of waiting for the month’s results, you see the state of your department every single day: lead quality, funnel fullness, rep activity, conversion by source, rejection reasons, and the sales plan forecast. The faster a manager notices deviations, the more room there is to fix the situation before the plan gets missed. In an environment of growing competition, this kind of reaction speed can become a decisive competitive advantage for your business.

In this article:
See more
Book a FREE sales funnel audit
CONTACT US
FAQ
How to Quickly Identify Sales Issues?

Set up automatic reports on key metrics: lead quality, funnel conversion, rep activity, and request processing speed. Check them daily, not at the end of the period.

Why might reporting automation not work?

The main reasons for failure: unstructured sales processes, poor CRM discipline, lack of standardized funnel stages, and team resistance to change.

What kinds of dips can you find through sales department analytics?

A decline in lead quantity and quality, slower processing speed, dropping conversion at specific stages, a longer deal cycle, source-level conversion dips, and reduced rep activity.

Do you need notifications for sales deviations?

Yes, notifications help you react to problems the moment they arise. Set up notifications for critical events: overdue leads, stalled deals, and conversion dropping below normal.

SUBSCRIBE TO MY TELEGRAM CHANNEL
The most valuable sales information right on your phone!
icon

LOTS OF USEFUL INFORMATION, FREE TEMPLATES, AND CHECKLISTS ON MY INSTAGRAM

Materials and practical advice on sales growth in our blog: