icon

Workload Norms: How Many Deals Does One Sales Manager Really Close

The owner looks at the sales department and asks a simple question: how many clients, leads, and active deals should one manager handle so the department works at full capacity without people burning out within three months. The Head of Sales usually answers intuitively, relying on numbers from past experience or advice from colleagues in other markets. This is how the sales plan for one manager turns into guesswork instead of a management tool.

Want a high-performing sales team without the hassle?
We’ll build it for you.
Contact Us

Key Takeaways

  • There’s no universal deal target per manager: cycle length and sales model completely change the numbers.
  • A manager’s workload is made up of leads, active deals, the client base, and administrative tasks – not a single figure in a report.
  • An active pipeline and “sleeping” deals in the CRM are two different things. Workload should only be calculated based on deals that are actually moving.
  • A manager with five deals in a long B2B cycle can be more loaded than a colleague with thirty deals in a short cycle.
  • Growing lead volume without growing the team doesn’t lead to more sales – it creates overload and drags down conversion across the whole funnel.

In the article below you’ll find workload calculation formulas, signs of manager overload and underload, and what to change in the process so the sales plan stays realistic. Read the article below 👇

There’s no single sales manager workload norm, and that’s normal. A manager selling a subscription with a three-day cycle physically cannot handle the same number of active deals as a colleague closing an industrial contract over six months. They have different funnels, different numbers of touchpoints, and different conversion rates at each stage.

In this article, we’ll break down how to calculate workload through the funnel, manager’s time, deal cycle length, and sales plan, rather than blindly copying someone else’s norms.

Why You Can't Set a Single Deal Target for All Managers

The phrase “our norm is 50 deals per manager” sounds solid at a team meeting, but on its own it means almost nothing. The deal target per sales manager should reflect your company’s specific sales process, not some abstract number picked up at a conference or copied from a competitor.

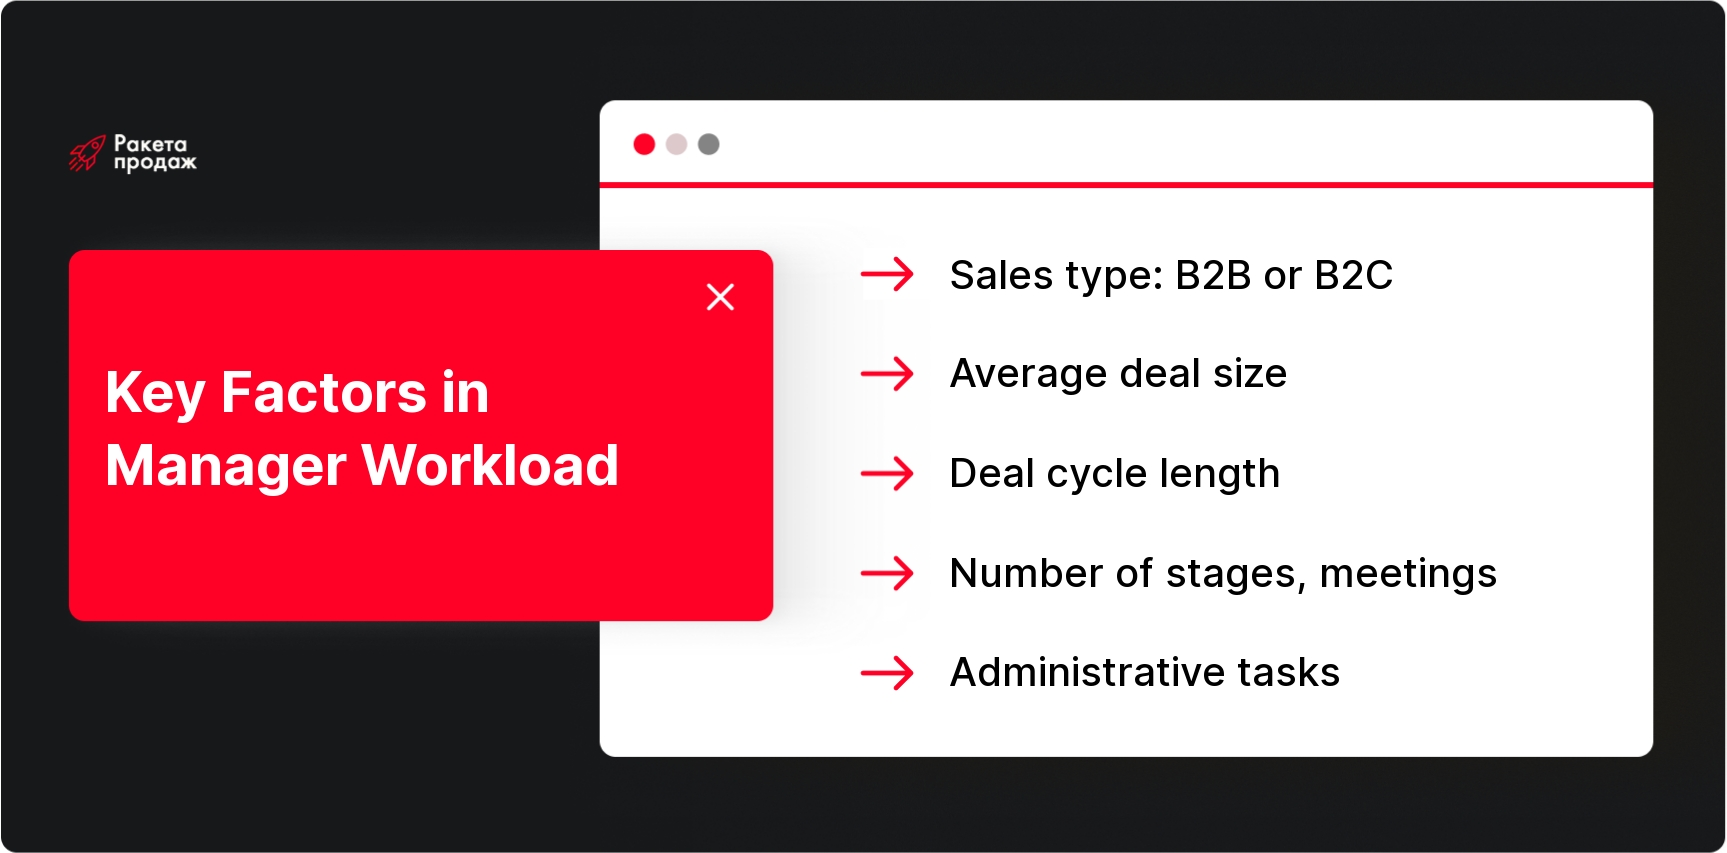
Real workload is affected by a dozen parameters at once, and it’s their combination that determines how many deals a sales manager can handle without losing quality. The difference between B2B and B2C requires a different pace, inbound leads are processed differently than cold ones, and the average deal size and length directly set the acceptable pipeline volume.

  • Sales model: B2B or B2C, inbound or cold outreach.
  • Average deal size, deal length, and number of decision-makers.
  • Number of meetings, the need to prepare proposals, calculations, and go through technical approvals or tenders.
  • Share of repeat sales, availability of assistants, and level of CRM automation.
  • Volume of administrative work not directly related to sales.

The norm needs to be calculated based on your own sales process, not someone else’s report. Before moving on to numbers, it’s worth understanding what actually makes up a manager’s workload, which brings us to the next question.

Sounds familiar: the Head of Sales announces a norm of “50 deals per manager” at a team meeting, but in reality no one can explain where that number came from or why it even fits your funnel. That’s what running a sales department by gut feeling looks like – when workload is estimated by intuition instead of process math.

At “Sales Rocket,” we start working with any team with an audit: we go through the CRM, listen to calls, review correspondence, and calculate the real throughput of each manager – by leads, active deals, and client base. Based on this data, we build not abstract but personalized workload norms and KPIs that reflect your cycle length, average deal size, and sales model, whether it’s B2B, B2C, or account management.

Over 8+ years, we’ve run this kind of diagnostics in 208 sales departments across 14+ industries, and the norm came out different every single time – because it’s calculated from the process, not copied from someone else’s report. The result of this work is a team that doesn’t burn out from overload, doesn’t sit idle from underload, and consistently closes 150% of plan.

Calculate your team's real workload instead of guessing at team meetings - get a free sales department audit!

What Counts as a Sales Manager's Workload

A sales manager’s workload isn’t a single number, it’s several different streams of work that rarely match in volume. A sales manager’s workload consists of new leads that need to be processed and qualified, active deals where the client is actually making a decision, an existing client base that needs to be maintained and grown, and dozens of activities: calls, meetings, correspondence, proposals, and follow-ups.

A separate category that’s often forgotten is non-selling tasks: reports, approvals, information gathering, and paperwork. This is usually what eats up hours that were formally counted as sales time. The number of clients per sales manager in the CRM and the number of active deals are fundamentally different metrics: a hundred contacts in the database and a hundred deals that are actually moving toward payment require completely different amounts of attention.

To understand where the line is between a normal workload and overload, you need to figure out how many active deals one person can physically handle.

How Many Active Deals Can One Manager Handle

The number of active deals per manager is a matter of arithmetic, not preference. The right answer to how many deals a sales manager can handle starts with figuring out how much time per week one deal requires at a specific stage of the cycle. Before calculating workload, it’s useful to look at what a manager’s daily routine actually looks like, to understand how much time is really left for selling versus supporting tasks.

The rough formula looks like this: the allowable number of active deals equals available selling time divided by the average time spent servicing one active deal. For example, if a deal requires several calls, a meeting, a calculation, and a follow-up, throughput will be noticeably lower than in a simple transactional sale where the decision is made in a single conversation.

An important point that’s often overlooked: dozens of “sleeping” deals in the CRM are not the same as an active pipeline. A deal postponed for two months barely takes up any of a manager’s time, while an active one, where the client is waiting for an answer today, requires attention every day. That’s why the number of deals per manager should only be calculated based on opportunities that are actually moving, not the total number of cards in the system.

But the number of active deals changes significantly depending on how long your product’s cycle is.

How Deal Cycle Length Affects the Workload Norm

Deal cycle length is one of the main factors determining a sales manager’s workload norm. The shorter the cycle, the more leads and deals pass through one person per month, but the less time remains for each one. In a short cycle, a manager works on volume: more touchpoints, quick qualification, minimal deep involvement in any single deal.

In a medium-length B2B cycle, the picture changes. A manager has fewer active opportunities at once, but each one requires more negotiations, repeat calls, and follow-ups. And in a long project cycle, there may be even fewer active deals, but each one drags along several stakeholders on the client side, internal approvals, and extensive document preparation.

There’s a small paradox here: a manager with five active deals in a long B2B cycle is often more loaded than a colleague with thirty deals in a short B2C segment. Quantity doesn’t equal workload, and that’s worth keeping in mind when comparing sales manager productivity across different departments.

Similar logic applies to leads too, not just deals that are already open.

deal cycle length — Comparison of manager workload in short versus long deal cycles

How Many Leads Can One Manager Process

The question of how many leads a manager can process sounds simpler than what the number of leads per sales manager actually looks like in reality. One inbound lead may require an initial call, several follow-up call attempts, correspondence, qualification, recording data in the CRM, and setting the next step. Until these stages are mapped out, any number is just a guess.

You can use a simple formula for this: available time for initial processing divided by average time per lead gives you a manager’s theoretical capacity. That number then needs to be scaled down to account for meetings, existing deals, and administrative workload, because theoretical capacity and real throughput are different things. Lead targets per manager almost never match the spreadsheet calculation if the person already has an active pipeline and commitments to current clients.

The classic mistake sounds like this: marketing doubles the lead flow, but the number of managers stays the same. As a result, first-response time grows, some inquiries simply don’t get handled in time, and conversion drops across the whole funnel. More leads with the same team size isn’t growth, it’s overload that will eventually hit revenue.

Once the logic behind leads and deals is clear, we can move on to how the sales plan itself is built from these numbers.

Key Parameters for Calculating the Sales Plan for One Manager

The sales plan for one manager isn’t pulled out of thin air or copied from a neighboring department, it flows from the math of the funnel. The logic is simple: the revenue plan sets the required number of deals, the number of deals sets the required number of qualified opportunities, and those, in turn, determine how many leads need to come in.

The formulas look like this: number of deals equals sales plan divided by average deal size. Required opportunities equal the number of deals divided by close conversion rate. Required leads equal the number of opportunities divided by qualification conversion rate. To avoid recalculating all of this by hand every time, it’s convenient to run your numbers through a sales funnel calculator and immediately see where the calculation diverges from reality.

This is a calculation model, not a guarantee of results. If the final number of leads or active deals physically exceeds a manager’s throughput, the plan won’t be met without changes: either you raise conversion, change the process, or expand the team. That’s exactly why sales manager productivity and the sales target per sales manager need to be calculated together, not separately.

A separate story is the workload tied not to new deals, but to an already existing client base.

How Many Clients Can a Manager Handle from an Existing Base

The question of how many clients a manager can handle almost always comes down to what’s hiding behind the word “client.” Account workload depends on the frequency of repeat purchases, client size, product complexity, the number of contact people and SKUs, the need to prepare custom terms, receivables management, post-sale support, and the potential for further account growth.

To calculate the number of clients per manager in a meaningful way, it’s useful to split the base into three groups.

  • A-clients: large or strategic accounts that need regular personal attention and a fast response to any request.
  • B-clients: standard contact frequency, scheduled calls and meetings without much urgency.
  • C-clients: small buyers who can be served in a more automated way, through mailings or occasional targeted touches.

A hundred small clients and a hundred strategic B2B accounts are simply not comparable workloads, even if the number in the report looks the same. Before comparing yourself to the market, it’s worth looking at what workload and activity numbers other companies in a similar segment are working with.

clients per manager — Segmentation of a manager's client base into A, B, C tiers by attention level

Market Benchmarks and Norms: How Much Does One Manager Really Sell

There’s no universal norm, but general market benchmarks do exist, and you can use them as a starting hypothesis. A typical norm for closed deals per month for a B2C manager is a range of 15-30 deals, and for a B2B specialist with a higher deal size, 15-20. These are exactly the numbers that answer the question of how many deals a sales manager closes and how many deals a sales manager concludes on average across the market. In real estate, developers often name a minimum sales target per manager of 2-3 contracts per month with a stable lead flow.

Activity levels within segments vary even more, and this is clearly visible in the comparison.

Segment Calls per day Meetings or showings Approximate conversion
B2C, cold sales 40-100 3-8% lead → purchase
B2B, cold sales 20-40 1-2 meetings 15-30% lead → client
Warm base, inbound 30-60 above average for cold
Real estate 30-50 inbound, 50-80 outbound 8-12 meetings, 5-8 showings per week 25-40% showing → booking

The spread in these numbers is huge, and that’s normal: a product priced at a couple thousand hryvnias and an industrial project worth several million physically cannot have the same sales manager workload norm. Benchmarks are only useful as a starting point for setting sales manager workload targets, not as a ready-made standard to implement without adaptation.

But even a good conversion benchmark can easily turn into a harmful tool if used without context.

Why "Conversion Norms" Shouldn't Be Used Without Context

Comparing a manager to an abstract market norm is a risky habit. Conversion targets depend on lead source, brand, price, target audience, demand maturity, season, region, level of competition, and, of course, the manager’s own skills. The same product can sell with a 10% conversion rate through cold traffic and 35% through referrals, and that says nothing bad about a manager working with cold leads.

Instead of chasing a universal standard, it’s better to use several internal benchmarks.

  • Your own company’s historical conversion rate over the last few months.
  • The team’s median figure, not the average, which gets skewed by outlier deals.
  • The results of the best consistent performers as a realistic ceiling, not a dream.
  • A specific employee’s dynamics over time, not a one-off snapshot from a single week.

Once it’s clear how to read conversion numbers, it’s easier to spot another problem: the moment when a manager is already overloaded but hasn’t complained out loud yet.

Signs That a Manager Is Overloaded

Overload is rarely announced officially, the employee just keeps working, only worse. It’s easier to notice through changes in process than through direct complaints: people rarely admit they’re not coping, especially if they’re afraid of losing a bonus or their reputation on the team.

Several signals are worth checking regularly, rather than waiting until the problem becomes visible in revenue.

  • First response time to clients grows, and some leads stay unprocessed longer than the norm.
  • Deals sit for a long time without a next step, and follow-ups happen with noticeable delay.
  • The manager fills out the CRM worse, and funnel data becomes inaccurate or missing.
  • The deal cycle stretches out, and conversion at intermediate stages starts to decline.
  • Clients start calling back on their own because they didn’t get feedback on time.

The opposite situation, underload, also hurts the business, just in a different way.

sales manager overload — Signs of an overloaded sales manager surrounded by piling tasks and unanswered notifications

Signs That a Manager Is Underloaded

An underloaded manager usually looks calm and organized, which often masks the problem. They have few new leads, a small active pipeline, all follow-ups are done in advance, and free time isn’t filled with anything sales-related. Meanwhile, the existing client base doesn’t grow, and the plan doesn’t get met simply because there physically isn’t enough volume of opportunities to work with.

The solution here isn’t always simply to give more leads. It’s often more effective to add outbound activity, reactivation of a dormant base, deeper development of current clients, or a new territory to work. This lets you use spare capacity without bloating headcount and without the risk that a new flow of leads simply won’t have anyone to process it.

The difference in workload becomes even more noticeable when you compare how sales are structured across different business models.

How Workload Differs Across Sales Models

There’s no universal sales model, and whatever limits workload in one segment may not matter at all in another. In a car dealership, the bottleneck is lead flow and visits; in manufacturing sales, it’s technical approvals; and in account management, it’s service depth rather than the number of new contacts.

The table below shows the general logic without rigid standards. It helps you understand which metrics are worth tracking in your specific sales model before setting a sales plan for one manager.

Sales Model What Limits Workload What to Track
Inbound B2C processing speed leads, calls, deals
B2B with short cycle number of negotiations pipeline, proposals, deals
Complex B2B time per opportunity active deals, meetings
Manufacturing sales technical approvals projects, pipeline
Wholesale sales base plus new clients active clients, orders
Account management service depth number of accounts
Car dealership flow of leads and visits leads, visits, deals
Real estate showings and long follow-up active buyers

This table shouldn’t be used as a ready-made standard, it works as a checklist for diagnosing which parameters actually affect your workload. Given all these differences, the logic of this article can be summed up in one general conclusion.

The formulas in this article point you in the right direction, but turning them into a working standard for a specific team means pulling together CRM data, real time per deal, conversion at each funnel stage, and the specifics of your niche – and that’s already a full-scale project, not a back-of-napkin calculation. “Sales Rocket” takes this work off your hands: we run a deep sales department audit, calculate a benchmark funnel for your model, set realistic workload norms and KPIs for each manager, and then implement CRM dashboards for ongoing control of overload and underload. We’ve already done this for 208 companies across 14+ industries, including Mitsubishi, Yamaha, and Naftogaz, and we know what healthy workload looks like in cold sales, account management, and long B2B cycles. The result of this work is measurable: clients see an average revenue increase of +35%, sales conversion grows by 5–86% depending on the niche, and the best case we’ve shown is +$10,907,403 in monthly revenue growth over 4 months. Don’t spend months trying to fit someone else’s benchmarks to your team – let us calculate your real workload norm and build a plan that’s physically achievable, not just on paper.

Turn manager workload calculations into a systematic management tool instead of guesswork at team meetings - get a free audit right now!

Conclusion

image

A sales manager’s workload norm isn’t a table copied from someone else’s presentation, it’s a calculation built on the funnel, the deal cycle, and the team’s real throughput. A good sales plan for one manager provides enough leads and deals to hit the target without turning the workday into an endless list of unprocessed tasks. Once you start calculating workload through time, conversion, and cycle length instead of some nice-sounding number from someone else’s case study, the sales department stops losing clients to delays and gets a plan that can actually be met. Regular manager performance evaluation helps you spot in time when the calculated norm diverges from reality, and adjust the plan before it hits revenue.

In this article:
See more
Book a FREE sales funnel audit
CONTACT US
FAQ
How many leads can you give one manager?

It depends on the time needed for initial processing of one lead, the share of active deals, and administrative workload. Start by calculating theoretical capacity – divide available time by average time per lead – then scale the number down to account for the current pipeline.

How do you calculate the sales plan for one manager?

Through funnel decomposition: divide the revenue plan by average deal size to get the number of deals, divide deals by close conversion rate to get the required opportunities, and divide opportunities by qualification conversion rate to get the required leads.

How can you tell if a manager is selling enough?

Compare their numbers to the team’s median and to their own dynamics over past periods, not to an abstract market norm. Look not only at revenue but also at conversion, deal cycle, and CRM data quality.

Are there universal conversion targets in sales?

No, conversion depends heavily on lead source, price, region, and demand maturity. Market benchmarks can only be used as a starting hypothesis – the real benchmark should be your own company’s history.

When is it time to hire another manager?

When the calculated number of leads or active deals needed to hit the plan consistently exceeds the current team’s capacity, not just once during a peak month. Another signal is growing first-response time and falling conversion despite a stable lead flow.

SUBSCRIBE TO MY TELEGRAM CHANNEL
The most valuable sales information right on your phone!
icon

LOTS OF USEFUL INFORMATION, FREE TEMPLATES, AND CHECKLISTS ON MY INSTAGRAM

Materials and practical advice on sales growth in our blog: