Key Takeaways
- Weak lead handling before the first contact steals money before a rep even gets a chance to open their mouth – this is a technical failure, not a skills problem.
- Half of qualified leads never make it to a meeting because the rep ends the call with phrases like “we’ll get back to you” instead of a specific date and time.
- Deals stall after the proposal is sent not because of a bad product, but because the rep stopped driving the approval process and just waits for the client to come back.
- More than half of the clients who reach the approval stage never actually sign the contract, and the reason is often a lack of clear ROI or legal barriers that weren’t addressed in advance.
- A sales funnel analysis without an action plan, owners, and deadlines stays just a presentation with charts, and next quarter will show the same losses.
In the article below, you’ll see specific funnel stages, conversion numbers, and what to check at every step so you can stop losing customers into thin air 👇
The problem is that without a proper sales funnel analysis, it’s impossible to understand exactly where clients are slipping away. At the top of the funnel? After the first call? At the qualification stage? After the demo, or already during contract approval? Each of these scenarios calls for a different solution, and guessing the right one without hard numbers is nearly impossible.
In this article, we’ll break down the sales funnel of a real (anonymized) B2B company: with concrete data, stage-to-stage conversion calculations, and a breakdown of losses in the sales funnel. By the end, you’ll walk away with more than just a handful of observations – you’ll have concrete conclusions that a sales manager or business owner can put to use as early as next week.
Does this sound familiar – a funnel that looks fine on paper, yet the revenue plan still isn’t met? Leads keep coming in, reps keep working, but the results fall short of expectations? This is a classic problem that 70% of B2B companies run into when managing their sales department on their own. At “Sales Rocket,” over 8+ years of work, we’ve built a comprehensive sales funnel analysis methodology that pinpoints exactly where losses happen at every stage. Our diagnostics cover not just the numbers, but also an audit of processes, scripts, CRM, and the performance of each individual rep. As a result of this breakdown, our clients get a clear action plan that leads to systematic conversion growth. Over the years, we’ve built 208 sales departments across 14+ industries, delivering our clients an average revenue increase of +35%.
Turn the chaos in your sales funnel into a precise system with predictable results - get a professional sales department audit!
Case Context: Which B2B Company Are We Breaking Down
For this breakdown, we’ll take a company that sells a SaaS service for automating financial reporting. The target audience is mid-sized businesses with 50 to 500 employees, mostly in manufacturing and distribution. The average annual contract value is around $15,000, and the deal cycle runs from one to three months depending on the size of the client company.
The sales department has a sales manager and four reps – a typical structure for a company of this size, though many of the principles of SaaS sales department optimization apply here too. Leads come from three sources: paid advertising, outbound outreach, and a partner network of integrators. Some requests are processed automatically through the CRM, while others come to reps through personal contacts and referrals.
We’ve deliberately anonymized the company name and slightly adjusted the numbers, but the funnel logic itself, the stages, and the typical issues are drawn from real B2B sales practice. That’s exactly why this kind of sales funnel analysis is useful even for those selling a completely different product – the bottlenecks tend to repeat from company to company. Next, let’s look at why this kind of breakdown even matters and what it delivers in practice.
The Purpose of Sales Funnel Analysis
The point of analyzing the funnel isn’t to count leads and deals and fire off a report in a chat. The real goal is deeper: to understand at which stage the most clients are lost, which reps or channels convert poorly, and what management decisions need to happen right now.
Sales funnel diagnostics answer questions that usually just hang in the air unanswered. Does the company have enough leads to hit its plan? Are they even the right leads? Do reps reach out fast enough for the first contact? Is qualification handled well? Do clients actually get to the proposal stage, and why don’t deals close even after a good meeting?
Without this kind of breakdown, decisions get made by gut feeling: “let’s increase the ad budget” or “we need to train reps on negotiation.” Sometimes these steps are genuinely needed, but more often they miss the actual target. The next step is figuring out exactly what data you need for the analysis to be precise rather than a rough guess.
What Data You Need for Sales Funnel Diagnostics
A solid breakdown requires not just one metric, but a whole set of data over a period, usually a month or a quarter. Without this data set, any conclusions are just guesswork dressed up as diagnostics.
It’s worth mentioning CRM separately: without a single system and consistent statuses across all stages, the analysis will be inaccurate. Before diving into the numbers, it’s worth making sure the sales funnel itself was built correctly – that the stages reflect the client’s actual journey rather than just formal labels in the system. If reps track deals in different formats, some data gets lost and some gets distorted. That’s why sometimes the first step of the breakdown isn’t analyzing numbers at all, but cleaning up the tracking system itself.
Here’s the minimum data set without which sales funnel analysis doesn’t make sense:
- The number of leads by each source and their distribution over time.
- Funnel stages with the number of deals at each stage and the conversion between them.
- Average deal size, deal cycle length, and speed of first contact with a lead.
- Number of meetings, demos, and proposals sent.
- Reasons for rejections, deals stuck without a next step, and overdue tasks.
- Data by rep and by client segment, so you can see the differences within the overall picture.
Once all this data is collected and standardized, you can move on to the interesting part: looking at the company’s actual funnel and hunting for the leaks.
Sample Initial B2B Sales Funnel
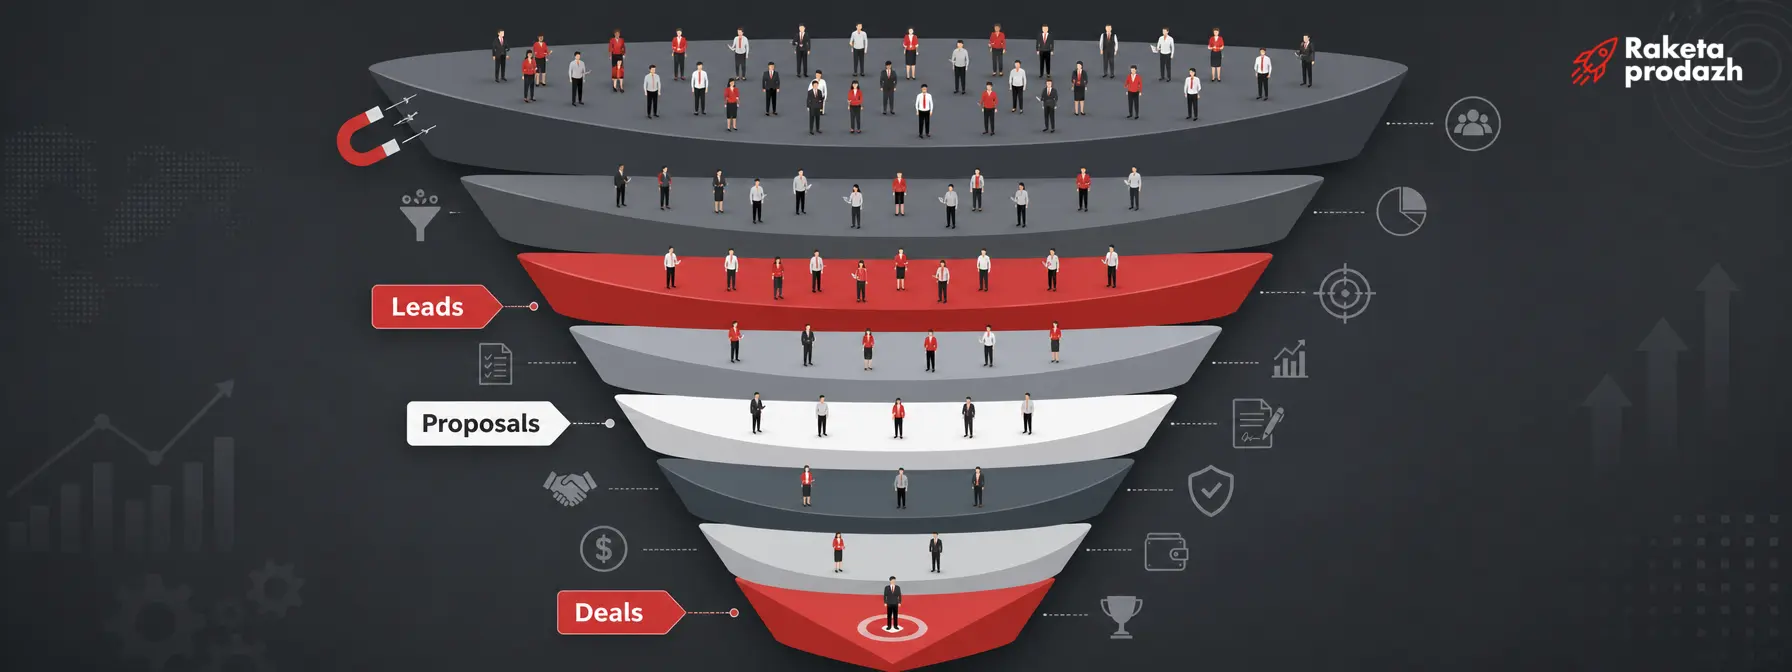
Here’s what our SaaS company’s funnel looked like over a quarter. The numbers are totaled across all reps, without breaking them down by source, so we can first see the overall picture.
| Funnel Stage |
Count |
Conversion from Previous Stage |
| New leads |
500 |
– |
| Processed leads |
420 |
84% |
| Qualified leads |
210 |
50% |
| Scheduled meetings/demos |
95 |
45% |
| Meetings held |
70 |
74% |
| Proposals sent |
50 |
71% |
| Active approval |
22 |
44% |
| Closed deals |
8 |
36% |
The overall lead-to-deal conversion works out to about 1.6%. That sounds alarming, but on its own, this number doesn’t say much. What matters far more is understanding at which stages the most clients are lost and why. That’s exactly what we’ll dig into in the next section.
A First Look at the Funnel: Where the Main Losses Show Up
This kind of sales funnel analysis immediately reveals two problem spots when you look at the table as a whole. The first is between qualification and scheduling a meeting, where conversion drops to 45%. The second is between approval and closing the deal, where more than half of the opportunities are lost. This isn’t a coincidence – it’s a typical picture for B2B, where decisions aren’t made by a single person.
It’s important to understand: a big drop at a stage isn’t automatically a problem on its own. For example, a lower conversion between qualification and the meeting might mean reps are honestly filtering out unqualified clients. Or it might mean they’re bad at setting up the next step. The difference is huge, and without further analysis of the causes, the conclusions will be superficial.
Losses in the sales funnel shouldn’t be read as a verdict, but as a reason to ask a specific question: “why do clients stop moving forward exactly at this stage?” Next, we’ll go through each stage individually and try to find answers to that question for this specific company.
Stage 1. New Leads: Is the Incoming Flow Enough
500 leads over a quarter is, on its own, neither a good nor a bad number. It all depends on how many deals need to close to hit the revenue plan, and on the quality of those leads. If the plan calls for 15 closed deals per quarter, and the actual lead-to-deal conversion is 1.6%, the company simply doesn’t have enough traffic.
Quality is just as important a question: do the leads match the ideal customer profile (ICP)? Do they have budget, decision-making authority, a real need? In our example, part of the outbound leads turned out to be from companies with fewer than 20 employees, which clearly doesn’t fit the target segment. That’s already a signal for marketing and business development.
A large number of leads doesn’t mean a healthy funnel. If a third of five hundred leads don’t even pass basic formal criteria, a high drop-off at qualification is inevitable further down the chain, and it would be unfair to blame the sales reps for that. It makes sense to move to the next stage and check what happens to leads before the first conversation with a rep.
Stage 2. Lead Processing: How Many Requests Are Lost Before First Contact
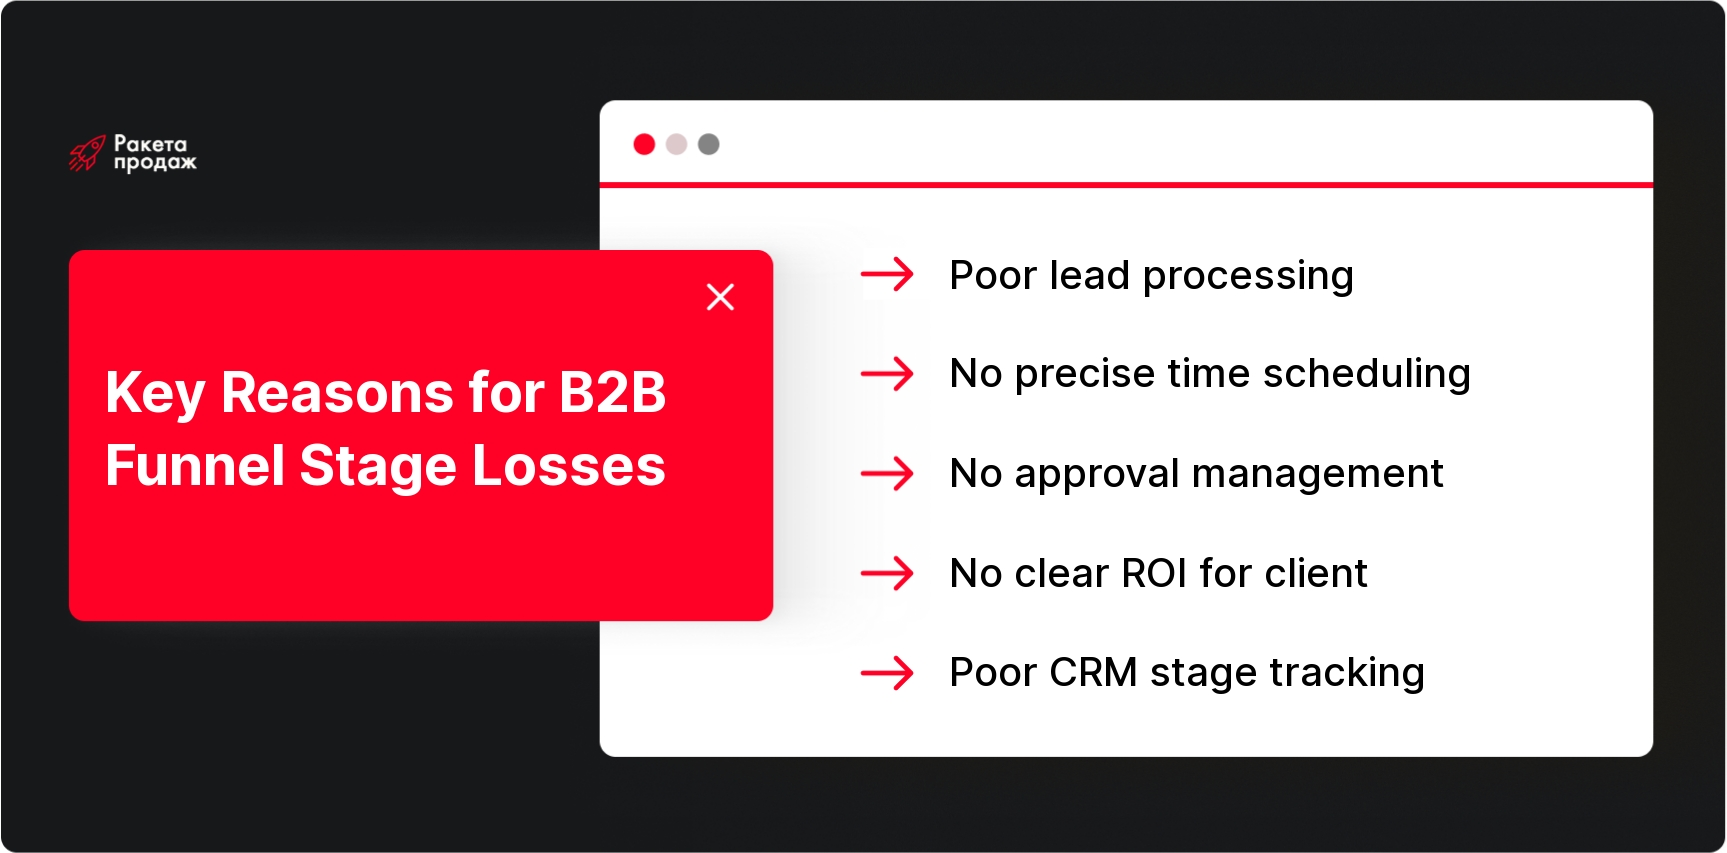
Out of 500 leads, only 420 were processed, meaning 80 requests never got a proper first contact at all. This is a critical number because it means losing money before the rep even said a word to the client.
The reasons behind such losses are usually mundane: reps can’t keep up with the incoming flow, there’s no automatic distribution of leads among staff, some calls get missed, and requests that come in during evenings or weekends just get lost in the shuffle. If tasks and SLAs for processing aren’t set up in the CRM, some leads go cold before the call even happens.
It’s important to note: this isn’t a negotiation skills problem, and no sales training will fix it. What’s needed here is process setup – distribution, response times, automatic reminders. Sales funnel analysis often reveals exactly this kind of “technical” loss, which is easy to fix but usually goes unnoticed until you actually start counting the numbers. Next, let’s move to a more nuanced stage – qualification.
Stage 3. Qualification: Why Half the Leads Don't Move Forward
Out of 420 processed leads, only 210 were deemed qualified. Half got filtered out, and the first question to ask is: is this a normal filter or a systemic problem? In B2B sales, a 40-60% qualification conversion rate is considered a normal working range, but the specific reasons for the drop-off matter more than the percentage itself.
In our case, analyzing the disqualification reasons revealed three main scenarios: some leads didn’t have budget for a solution of this scale, some came through employees without decision-making authority, and some were simply looking for free alternatives with no intention of paying for a subscription. To correctly interpret these motives, it’s worth considering not just formal ICP criteria but also buyer psychology in sales. It also turned out that advertising in one of the channels was bringing in noticeably more unqualified inquiries than the other sources.
To get a systemic handle on this, you need to look at several things at once: disqualification reasons by category, the share of qualified leads broken down by channel, the quality of the reps’ qualification script, and the required CRM fields that capture ICP criteria. Without this data, qualification turns into an individual rep’s intuition rather than a managed process. The next logical step is to understand what happens with leads that passed qualification but didn’t make it to a meeting.
Stage 4. Scheduling a Meeting or Demo: Why Qualified Leads Don't Make It to a Conversation
210 leads passed qualification, but only 95 got a meeting or demo scheduled. This is one of the most noticeable drop-offs in the funnel, and the cause is almost always how the rep ends the conversation. If the call wraps up with “we’ll get back to you” or “think it over and come back to us,” the lead is highly likely to fall out of the process.
In B2B, the next step should be specific: date, time, participants on the client’s side, the purpose of the meeting, and the expected outcome. If the rep doesn’t show the client the value of that specific conversation and doesn’t uncover a real sense of urgency, the client simply has no reason to carve out time in their calendar.
The problem is often compounded by a lack of automatic follow-up: if there’s no email with specific time slots right after the call, the lead goes cold within a couple of days. Some reps also psychologically avoid pushing hard for a meeting, afraid of coming across as pushy – this is one of the typical mistakes salespeople make, and it costs the company real money. Let’s look at what happens next with the meetings that did get scheduled.
Stage 5. Meetings Held: Why Scheduled Meetings Don't Happen
Out of 95 scheduled meetings, only 70 actually took place. That’s a show rate, and in our case 74% isn’t a disaster, but it’s not ideal either. Some clients simply didn’t show up, some rescheduled at the last minute, and some just disappeared without any explanation.
The reasons usually trace back to how the meeting was scheduled in the first place. If qualification was shallow, the client may have agreed to the call out of politeness, without seeing any real value in it. If the rep didn’t send confirmation and an agenda ahead of time, the client ends up feeling like the event isn’t really mandatory. Sometimes the problem is simple: the right participant on the client’s side wasn’t looped in, and the meeting loses its point without them.
Show rate is an important indicator of the quality of the entire scheduling stage, not just a matter of calendar reminders. If it’s low, you need to fix the actual reason the client agreed to the conversation, not just how often you remind them beforehand. Now let’s look at what happens with clients after a meeting that actually went well.
Stage 6. Proposal: Why Not Every Meeting Leads to a Proposal
Out of 70 meetings held, proposals were sent to only 50 clients. At first glance, this looks like a loss, but it isn’t always one: some clients turned out to be genuinely unqualified after the discovery call, and sending them a proposal wouldn’t have made sense.
The problem arises when the reasons for not sending a proposal aren’t tracked systematically. If the sales manager doesn’t understand why 20 meetings didn’t turn into a proposal, they can’t tell a healthy filter apart from a missed opportunity. A few things are worth checking: were the client’s real selection criteria uncovered during the meeting, is the budget clear, did someone with decision-making authority take part in the conversation, and was the proposal sent within a reasonable time after the meeting.
A proposal should work as a tool to move the deal forward, not just a formal document to check a box. A personalized proposal with concrete numbers and a clear next step pushes the deal ahead, while a generic PDF with no context from the conversation often just ends up sitting in the client’s “later” folder. Next, let’s break down the stage that’s most telling for B2B – the approval process after the proposal is sent.
Stage 7. Approval: Why Deals Stall After the Proposal
Out of 50 proposals sent, only 22 moved into active approval. This is one of the most characteristic pain points in B2B sales, because once the proposal is received, the deal enters the client’s internal process: a manager, procurement, finance, sometimes legal, and occasionally even a technical team that has to sign off on the decision.
If the proposal doesn’t address the client’s real needs or doesn’t account for objections raised during the meeting, it simply gets lost among other proposals. Often the issue isn’t the quality of the product, but the fact that the rep stopped following up right after sending it, hoping the client would come back with a decision on their own. In other cases, it turns out the real decision-maker was never actually brought into the conversation, and the proposal got stuck at the level of a rank-and-file employee with no authority to push it forward.
In B2B, the rep is responsible for driving the approval process, not just waiting for a response. That means knowing all the participants on the client’s side, the real decision-making timeline, the selection criteria, and the potential risks that could slow the deal down. Without this kind of management, the company loses clients not because of a bad product, but because of a passive approach at a critical stage. All that’s left is to figure out the final stretch, where it’s decided whether the deal actually reaches payment.
Stage 8. Closed Deals: Why Approval Doesn't Turn Into Payment
Out of 22 deals in active approval, only 8 closed. More than half of the clients who made it almost to the finish line never signed the contract or paid the invoice. This is a painful stage, because by this point marketing, the rep, and the client have all already put in effort, yet there’s still no result.
The reasons at this stage rarely come down to the rep’s work alone. Sometimes the client genuinely didn’t have budget left in the current quarter, sometimes they chose a competitor with better terms, and sometimes the process just got stuck in legal review of the contract. It also happens that the client doesn’t see enough ROI from implementing the solution, and without a clear economic justification, the deal gets pushed off indefinitely.
Final-stage losses in the sales funnel often point not just to weak value communication, but to the deal terms overall: price, contract, timelines, and the client’s own decision-making process. Breaking down this stage helps identify which changes to commercial policy or the approval process will have the biggest impact. Now that we’ve gone through every stage, it makes sense to move on to what to actually do about it.
An Action Plan After Sales Funnel Diagnostics
A funnel breakdown is only valuable when it leads to concrete actions with owners and deadlines. If the report stays just a presentation with charts, nothing will change, and next quarter will show the same pattern of losses.
For our company, the breakdown revealed several clear growth opportunities: weak lead processing before first contact, low conversion to scheduled meetings, and a passive approach to managing approval. Based on this, the sales manager can put together a specific task list with clear owners.
Here’s a sample action plan that logically follows from this kind of breakdown:
- Set up an SLA for lead processing and automatic distribution of leads among reps.
- Adjust the advertising sources that generate the highest share of unqualified inquiries.
- Update qualification criteria and add required CRM fields to capture ICP data.
- Rewrite the meeting-scheduling script to include a specific proposed date, time, and purpose for the conversation.
- Set up automatic follow-up after sending a proposal and track deals that lack a next step.
- Create a dedicated process for supporting deals in the approval stage with large clients.
Once these changes are implemented, it makes sense to repeat the sales funnel analysis in a quarter and compare the progress at each stage individually.
Sales funnel analysis isn’t a one-time exercise – it’s the foundation for systematically improving your sales department’s results. Applying the principles described in this article will help you better understand where you’re losing clients, but to guarantee revenue growth, it’s worth trusting this work to experts. “Sales Rocket” specializes in comprehensive diagnostics and turnkey sales department development: from analyzing current processes to a full funnel overhaul with CRM implementation, team training, and control system setup. Our methodology includes a detailed breakdown of every stage with identification of specific growth opportunities, the development of personalized scripts and processes, and ongoing support throughout implementation. Our clients include companies like Mitsubishi, Yamaha, and Naftogaz. Over 8+ years, we’ve built 208 sales departments, increasing client conversion rates from 5% to 86%, with our best result being +$10,907,403 in revenue growth in 4 months. Don’t waste months experimenting with uncertain results.
Build a sales funnel that works like a precision mechanism and delivers predictable profit!
A real B2B funnel is almost always more complex than the final revenue number at the end of the month would suggest. To find growth opportunities, it’s important to look not just at the number of leads coming in, but at the client’s entire journey: from first contact to a signed contract and repeat sales.
Regular sales funnel diagnostics helps you spot losses faster, define clearer tasks for sales managers and marketing, and boost conversion without resorting to chaotic decisions like “let’s just hire more reps” without understanding the real cause of the problem.


 Time to read: 9 min.
 26 August 2026