Key Takeaways
- A manager who spends more time collecting numbers than analyzing the reasons for deviations is already running the department with a delay.
- A weak reporting system reveals the problem at the end of the month; a strong one signals it in the second week, while the plan can still be saved.
- Your plan-actual report should let you drill down from total revenue into details by manager, source, funnel stage, and product – otherwise it’s just a pretty number with no explanation.
- Revenue deviation almost always originates higher up the funnel: the gap is visible in lead qualification, meetings, and deal-processing speed one to two weeks before it shows up in the money.
- Managers who keep the CRM differently turn any automation into an accelerator of chaos rather than order.
- Forecasting sales plan completion based on gut feeling instead of CRM data turns the planning meeting into guesswork instead of a management session.
In the full article below, you’ll find nine specific signs with quick self-check tests, a set of dashboard metrics, and a sales department self-diagnosis checklist with scoring 👇
A manual plan fact report simply can’t keep up with reality at that pace. Automated plan-actual reporting solves exactly this problem: it shows deviation from the plan not at the end of the month, but as things unfold, giving you time to react before the numbers in the report become a verdict.
Below are nine signs that tell you the moment has already arrived. Each one comes with a quick test you can run right now, without opening a single digital transformation presentation.
What Is Plan-Actual Analysis and Why Do You Need It
Plan-actual analysis is comparing what you planned with what actually happened. Sounds simple, but this comparison is what all sales department management rests on. Without it, a budget turns into a nice-looking document nobody checks.
To answer briefly how to calculate the plan-actual variance, the formula is simple: the difference between actual and plan, divided by the plan and multiplied by a hundred, gives you the deviation as a percentage. But the number alone doesn’t explain the cause, which is why plan-actual sales analysis always goes deeper than a single formula. It’s built across several dimensions: by responsibility groups (by manager or by team), by product line, and by sales channel.
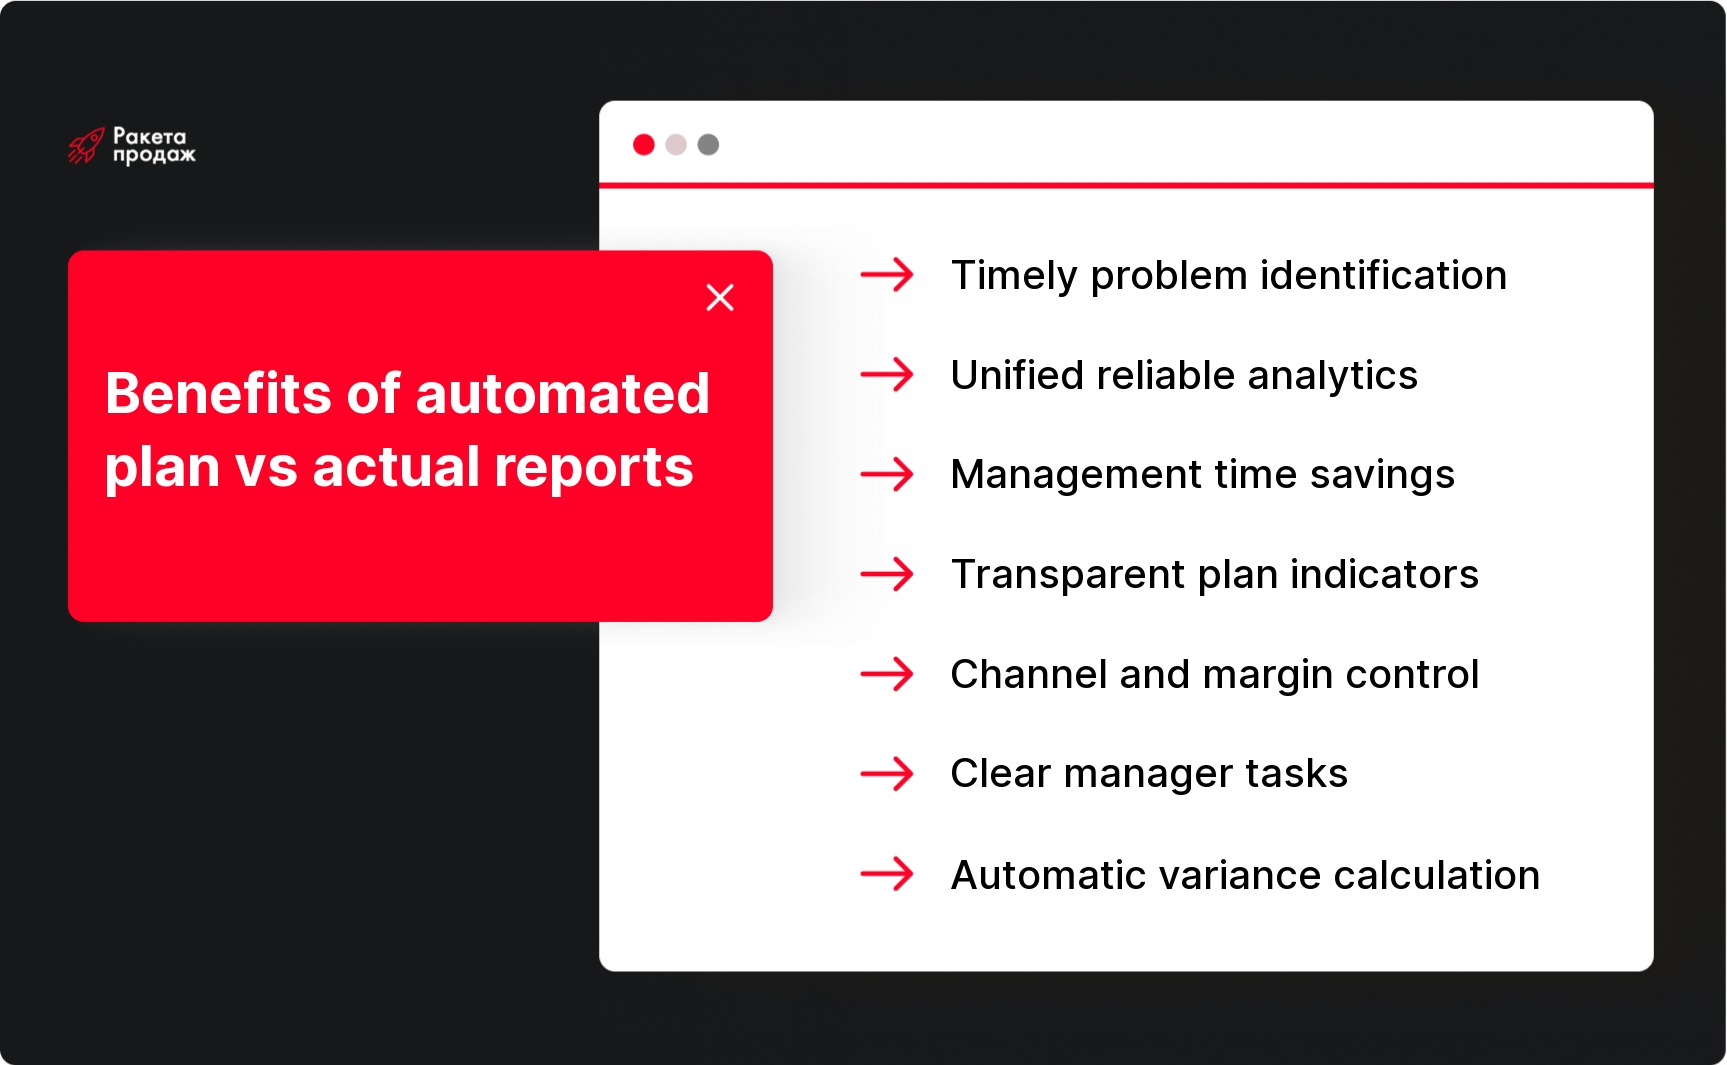
To understand why manual plan-actual analysis stops holding up over time, it’s worth comparing it to an automated approach.
Sound familiar – reports taking longer to prepare than to analyze? When the plan isn’t met again at month’s end, and the reasons remain a mystery? Most managers trying to run a growing team through spreadsheets run into this.
At Rocket Sales, over 8+ years we’ve built a systematic approach to plan-actual reporting. Our experts implement CRM systems with integrated dashboards that automatically pull data from every source and show deviations in real time. We’ve built 208 sales departments across 14+ industries and work with companies ranging from small teams to corporations, including Mitsubishi, Yamaha, and Naftogaz. After implementation, clients get full sales visibility, save dozens of hours of management time per month, and reach consistent plan fulfillment – the average revenue increase is +35%.
Turn reporting chaos into a system of precise control - get a free audit of your sales department's automation!
How Automated Plan-Actual Reporting Differs from Manual Reporting
With a manual approach, the entire plan fact report rests on one person. The sales manager or owner opens the CRM, copies numbers into a spreadsheet, adds data from ad accounts, cross-checks with call tracking and manager reports. By the time all this is compiled, part of the data is already outdated, and an error could have crept into the formulas, skewing the whole picture.
Automated sales department reporting works differently. The system automatically pulls data from the CRM and connected services, updates metrics on schedule, and calculates deviations instantly. The manager doesn’t need to compile anything by hand – the plan-actual report is generated automatically, and problem areas are highlighted on their own.
The point here isn’t a pretty dashboard for its own sake. Sales reporting automation exists for the sake of reaction speed. The faster you see a dip, the more time you have to fix it – instead of just recording it in a report after the month is over.
But when exactly does the manual format stop working, and when is it time to switch to automation?
When Manual Sales Reports Are No Longer Enough
Manual reports aren’t bad in themselves. At the start, when a department has two or three managers and a dozen deals, a spreadsheet works great. The problem begins when there’s too much data: several lead channels, different products, a dozen people on the team – and all of it needs to be pulled into one picture every week.
It’s worth calculating once what manual reporting actually costs. Take the six hours a week a manager spends compiling numbers – that’s 24 hours a month, roughly three full working days, or 15% of their time. Add 15-20 minutes a day that each salesperson spends “reporting in the chat” and maintaining parallel spreadsheets: for a team of eight, that’s another roughly 50 hours. In total, more than 70 hours a month go into simply finding out what already happened. Automation doesn’t just save these hours – it returns them to working with people and deals.
Automated plan-actual reporting becomes necessary not because spreadsheets are unfashionable. It’s needed when decision-making speed starts to matter more than the habit of keeping an Excel report. Next, let’s break down nine specific signs that tell you it’s time.
Sign 1: The Manager Spends Too Much Time Collecting Reports
If the sales manager, owner, or commercial director manually pulls numbers from the CRM every week, cross-checks them against spreadsheets, checks ad accounts, and follows up with managers in chat, that’s already a red flag. Instead of digging into the reasons for deviations and making decisions, the manager is copying data and checking formulas.
A telling test is simple. Compare how much time goes into preparing the report versus discussing it. If gathering data takes hours, and only the last ten minutes of the meeting are left for conclusions and decisions, the reporting system is already slowing down the whole sales department. This is a direct signal that automated plan-actual analysis will save not just time, but the quality of management decisions.
How to check in 5 minutes: look at your last planning meeting. If the discussion started with “hold on, let me finish adding up the numbers” – the test failed.
Sign 2: The Numbers in the CRM, Spreadsheets, and Reports Don't Match
A familiar situation: the CRM shows one number of closed deals, the manager’s spreadsheet shows another, and the financial report shows a third. Add comments from salespeople like “actually, the deal is already closed, we just haven’t updated the status” – and the sales meeting turns not into a review of deviations, but into an argument over which numbers to even believe.
The cause is usually that data is pulled from different sources without unified rules. Automated sales department reporting needs to close this question once and for all: clearly defining where the plan comes from, where the actual comes from, which deals and statuses are counted, and who’s responsible for data quality. When there’s a single source of truth, the plan-actual report stops being a source of arguments and becomes a working tool.
How to check in 5 minutes: ask three people – the manager, the marketer, and the accountant – for last month’s revenue. If you get three different numbers, you don’t have a single source of data.
Sign 3: Dips Are Only Noticed at the End of the Month
A classic scenario: on the 28th, it becomes clear the plan won’t be met. There’s no time left to fix anything – all that’s left is to record the fact. But the problem started much earlier: fewer new leads, dropped manager activity, fewer meetings scheduled, delayed proposals, or deals stuck at the approval stage.
Automated plan-actual analysis lets you spot the deviation not at the end of the period, but in the middle – and sometimes even earlier, through intermediate metrics. A simple technique helps here: compare not “plan for the month” versus “actual for the month,” but pace. The system knows that today is the twelfth working day out of twenty-one, meaning about 57% of the plan should be closed by now. If only 38% is actually closed, the gap is visible today – not on the thirtieth.
If, in the second week of the month, you can see that the number of meetings and proposals sent is falling behind pace, the manager still has time to redistribute workload, add leads, or personally step into problem deals. That’s the difference between managing by results and managing by deviations.
How to check in 5 minutes: state what percentage of the monthly plan should be complete by today. If you don’t have that answer on hand, you’ll be the last to notice the deviation.
Sign 4: The Manager Sees the Revenue but Doesn't Understand Why It's Off
Total revenue is a result, not an explanation. If actual is below plan, the number itself won’t tell you what happened: not enough leads, salespeople processed requests too slowly, conversion dropped at some funnel stage, fewer meetings happened, the average check declined, rejections increased, or a couple of big deals simply didn’t close.
A good plan-actual report should let you drill down from the total figure into details: by manager, lead source, funnel stage, product, region, or line of business. Then, instead of asking “why wasn’t the plan met,” the manager immediately gets an answer about exactly where the bottleneck formed. That’s the difference between a report for show and a report you can actually make decisions with tomorrow, rather than guessing at quarter’s end.
How to check in 5 minutes: take the last unmet plan and try to name, within two minutes, the funnel stage where the gap originated. If you can’t, you don’t have enough detail.
Sign 5: The Sales Department Has Grown, but Reporting Is Still at the Spreadsheet Level
The department now has several managers, different lead sources, several sales directions, different products or customer segments. But the report still lives in a single spreadsheet that someone heroically maintains by hand every week.
The problem is that as the team grows, the number of needed breakdowns grows faster than the team itself. You need to see plan-actual across the whole team, by each manager, by channel, by product, by funnel stage, and a forecast for each dimension. A manual spreadsheet that worked great with five rows starts to buckle at fifty, and formulas nobody’s checked in months quietly distort the picture. At some point, the spreadsheet stops being a control tool and becomes a source of added risk.
How to check in 5 minutes: if the company’s key report breaks the moment its author goes on vacation, that’s not a system – it’s one person’s personal file.
Sign 6: Managers Keep the CRM Differently
One manager logs a meeting as a task, another writes about it in a comment, a third forgets to update the deal status entirely, and a fourth closes a deal as “lost” without stating a reason. As a result, even the most beautiful plan-actual report doesn’t show the real picture – just whatever happened to make it into the system.
Automation doesn’t fix dirty data – it just shows it faster. That’s why automation has to go hand in hand with CRM discipline rules: mandatory fields, unified deal statuses, control over overdue tasks, and mandatory reasons for lost deals. Without this basic discipline, the system won’t bring order – it’ll just speed up existing chaos.
How to check in 5 minutes: open the last ten lost deals. If half of them have no reason filled in, or it’s written as free-form text, there’s nothing to automate yet.
Sign 7: It's Impossible to Quickly Assess a Manager's Performance
A manager needs to see not just the department’s overall result, but each individual person’s contribution: plan versus actual, activity, conversion, number of deals in progress, overdue tasks, average check, reasons for losses, and forecast for the selected period.
If assessing one salesperson requires manually opening dozens of deal cards, recalculating calls, meetings, and proposals sent, it’s long past time for the department to switch to automated plan-actual reporting. And this isn’t about total control for control’s sake. The goal is to manage by deviations: to see who’s falling behind plan and why, and step in in time – instead of sorting it out after the fact during the end-of-month post-mortem.
How to check in 5 minutes: time how long it takes you to get a full picture of one manager. More than five minutes means you’re simply not doing this regularly.
Sign 8: You Can't Connect Marketing, Leads, and Sales
Marketing reports on the number of leads and cost per lead, sales reports on revenue, and somewhere between these two reports the whole picture gets lost. The manager sees that there seem to be enough leads, but revenue isn’t growing, and can’t tell where the connection breaks down.
Automated plan-actual reporting needs to account not just for sales results but for the top of the funnel too: lead source, the speed and quality of processing it, conversion into a deal, and actual revenue from that source. When this data is linked in one report, you can immediately see which channel is falling behind plan, where there are too many unqualified leads, and which sources actually generate revenue rather than just nice numbers in the marketer’s report. What’s more, ad spend sits right alongside sales: you can see not just cost per lead but cost per deal by source – which becomes grounds for reallocating budget. It’s precisely at this intersection of data that separate sales analytics implementation is often needed, bringing marketing and sales metrics together into one system.
How to check in 5 minutes: name the channel with the lowest cost per deal (not cost per lead). If you don’t know the answer, your budget is being allocated blind.
Sign 9: Plan Forecasting Is Based on Gut Feeling, Not Data
“Should close this week,” “the client’s basically approved it,” “they’ll probably pay” – familiar phrases from every planning meeting. The problem is that these forecasts often have nothing concrete behind them: no deal stage, no closing probability, no date for the next step, no history of client touchpoints.
Automated plan-actual analysis builds a forecast differently. Every deal is weighted by the probability of its stage: negotiations carry one probability, an issued invoice or reservation another, a received prepayment yet another. The sum of these weighted deals plus payments already received is a realistic forecast for closing the period. It answers the question “will we make it or not” while there’s still time to act, and immediately shows which deals are at risk. That turns the forecast from a pretty number in a report into a working tool you can rely on when planning resources and team workload.
How to check in 5 minutes: compare the forecast the team gave in the middle of last month against the actual result. A gap greater than 15% means the forecast isn’t a real tool yet.
What Changes After the Switch: Benefits for the Manager and the Salesperson
Reporting automation is often sold as a story “for management.” In practice, it only takes root when the rank-and-file salesperson feels the benefit too. If they see the dashboard as a tool of control and punishment, they’ll start fearing the numbers and fudging the data. If they see it as a tool that helps them earn more, they’ll watch the quality of their own CRM entries themselves.
What the manager and owner get
- Forecast instead of hope: by mid-month, it’s already clear how the month will close, and there’s time to close the gap.
- Management by deviations: the signal arrives on the day the problem occurs, not after the period closes.
- A single source of truth: the planning meeting starts with reviewing causes, not arguing over whose report is correct.
- Channel economics: you can see cost per lead and cost per deal by source, so you know what to scale and what to cut.
- Team evaluation based on process, not feeling: activity, response speed, conversion at each stage.
- Reclaimed time: dozens or hundreds of hours a month move from spreadsheet compilation into work with people and deals.
- Scalability: when the team doubles, management workload doesn’t double with it.
What the salesperson gets
- A clear distance to plan and to bonus: not “you need to sell more,” but a specific sum and number of deals given the current average check.
- A plan broken down into actions: daily targets for new leads, meetings held, and proposals sent – the things a salesperson actually controls.
- Zero manual reporting: no need to compile your own totals in the evening and duplicate them into chat and into the manager’s spreadsheet.
- Money found in your own pipeline: the system flags deals that have been stuck at one stage too long or have no next step scheduled.
- Protection from unfair complaints: if a channel dipped or lead volume dropped, it’s visible in the numbers.
- Transparent rules of the game: lead distribution and workload are visible to everyone, leaving less room for resentment.
The practical takeaway is simple: give managers access to their own personal dashboards. A report that only the leader sees, the team perceives as surveillance. A report everyone sees becomes a shared tool.
What Metrics to Include in an Automated Plan-Actual Report
The set of metrics depends on the sales model, deal cycle length, and the number of channels bringing in leads. Before moving on to choosing reporting software, it’s worth settling on a baseline set of metrics that almost any sales department needs regardless of niche. It’s important to build in not just final metrics like revenue, but leading indicators that signal a future dip before it hits the money.
Here’s the minimum set of metrics worth including in an automated plan fact report.
- Revenue, margin, number of deals, and average check – basic financial metrics showing the final result.
- New inquiries, qualified leads, scheduled meetings, and proposals sent – leading indicators of the top and middle of the funnel.
- Conversion by funnel stage and request processing speed – metrics on the quality of lead handling and the team’s response speed.
- Average time a deal spends at a stage – the earliest indicator of deals stuck in the pipeline before they turn into a loss.
- Manager activity and number of overdue tasks – indicators of discipline and actual team workload.
- Reasons for lost deals, plan-actual broken down by source, and plan-actual by manager – data for finding bottlenecks.
- Ad spend, cost per lead, and cost per deal by channel – linking marketing to sales in one table.
- Plan forecast, percentage of plan completed, and pace relative to plan – metrics for forecasting and tracking dynamics.
This set gives you a full picture. You see not just how much money came in, but why it came out to exactly that amount, and not more or less.
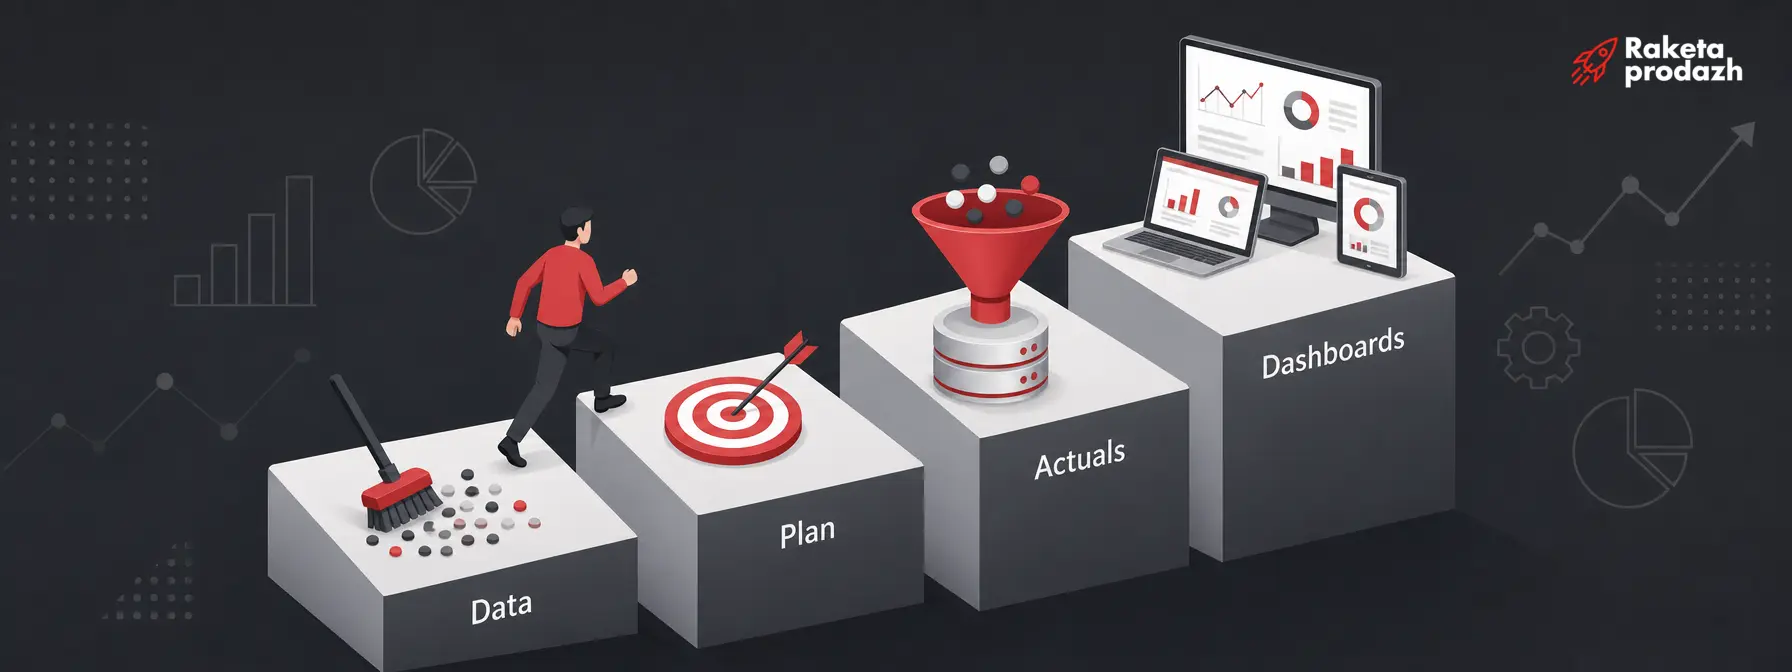
What the Switch to Automated Reporting Looks Like
Implementation is usually broken down into four steps, and only one of them is truly technical.
- Cleaning up the data: the funnel is aligned with the real sales process, mandatory fields, unified statuses, and rules for recording lost-deal reasons are defined.
- Setting the plan through reverse calculation: from target revenue back to the number of deals, meetings held, and new inquiries needed, distributed across managers and working days, accounting for schedules, vacations, and holidays.
- Collecting the actuals: data from the CRM, call tracking, forms, and ad accounts automatically flows into a single repository following pre-agreed metric calculation rules.
- Role-based dashboards: a summary screen for the owner, a team-level one for the manager, a personal one for each salesperson, plus a protocol for who reacts to deviations and how.
The technical layer is usually set up within a few weeks. What takes the longest isn’t the tech – it’s the first and fourth steps: data discipline and management rhythm. That’s exactly why projects that reduce automation to just connecting a dashboard usually end up with a pretty picture that nobody looks at a month later.
Checklist: Does Your Sales Department Need Automated Plan-Actual Reporting
If reading this article felt a little too familiar, here’s a short checklist to help you run a kind of sales department audit and check it more precisely. Go through the items and count how many apply to your company.
- Reports are compiled manually from several sources every week or month.
- The numbers in the CRM, spreadsheets, and financial reports don’t match each other.
- The plan is only checked at the end of the month, when it’s already hard to fix anything.
- Sales dips are discovered too late, rather than during the period.
- It’s unclear why actual differs from plan, and you have to guess.
- Managers keep the CRM differently, without unified rules and statuses.
- It’s hard to quickly assess each manager’s contribution to the overall result.
- There’s no visible connection between marketing, leads, and final sales.
- Plan forecasting is based on managers’ gut feeling rather than CRM data.
- The manager spends time collecting numbers instead of analyzing causes.
- The company has no automatic calculation of plan-actual deviations.
- The owner needs quick management snapshots, not a once-a-month report.
- The sales department is growing, and a single spreadsheet is clearly no longer enough.
Now count the items you checked.
- 0-3 matches: the system is still holding up. Just tidy up your CRM rules and revisit this when the team grows.
- 4-7 matches: your reporting is already falling behind the business. Automation will pay off primarily through reclaimed management time and earlier detection of dips.
- 8 or more: you’re running the department with a delay of several weeks. This isn’t about convenience anymore – it’s about money being lost while the problem stays invisible.
Automated plan-actual reporting isn’t just pretty charts – it’s a tool that delivers a competitive edge. The ability to see deviations in real time, make decisions based on data rather than intuition, and manage growing teams without increasing management workload. Rocket Sales specializes in building such systems end-to-end: from setting up the CRM and integrating marketing tools to creating personal dashboards for every level of management. Our methodology includes analyzing current processes, choosing and implementing the right CRM system, setting up automated reporting, and training the team to work with the new tools. Statistically, our clients achieve an average revenue increase of +35%, with the best result reaching +$10,907,403 in 4 months. Our partners include companies like Mitsubishi, Yamaha, and Naftogaz. Don’t waste months trying to automate your reporting on your own – leave it to the professionals.
Don't waste months trying to automate your reporting on your own - build a system that catches dips before they turn into a missed plan!
A plan fact report becomes truly important the exact moment a sales department grows. There’s more data, more channels, more managers, and more points to track simultaneously. The manual spreadsheet that worked great at the start simply can’t keep up with that pace, and the manager spends time collecting numbers instead of digging into the reasons for deviations.
Automated plan-actual analysis solves exactly this problem. It helps the owner and manager move from manually copying numbers to managing by deviations: spotting problems before they hit revenue, finding causes faster, and making decisions while the month can still be saved. And for the salesperson, it provides clear rules of the game and a clear sense of distance to their own results – without which no automation ever really takes root on a team.



 Time to read: 9 min.
 17 August 2026