icon

How to Select Reporting Metrics: Measure What Matters Without Overloading

A familiar situation: a sales manager receives a monthly report – 20 pages of tables with dozens of indicators, but can’t understand whether their team is performing well or poorly. Or a company director reviews a dashboard with multiple graphs and gets lost trying to determine what decisions need to be made. The problem with modern reporting is that in the pursuit of “data about everything,” we often create information noise that prevents us from seeing what’s important.

Want a high-performing sales team without the hassle?
We’ll build it for you.
Contact Us

Key Takeaways

  • Your brain can only retain 5-7 elements, a report with 20 indicators scatters attention and blocks decisions.
  • Each metric should answer the question: what action will I take if this indicator changes? Without an answer – exclude it from the main report.
  • Strong metrics are manageable. Indicators that the team cannot influence (total market volume) demotivate and create frustration.
  • Companies that track 3-5 key metrics grow faster than those trying to control everything.
  • Vanity metrics (number of calls without conversion, subscribers without sales) look good but don’t get you closer to your goal.

In the article below, you’ll find the exact algorithm for selecting metrics that transform reporting from bureaucracy into a working sales management tool 👇

There is a fundamental difference between “metrics for reporting” and “metrics for management.” The first are collected formally to check a box, while the second help make decisions and improve sales. By learning to separate one from the other, you can transform reporting from a bureaucratic ritual into a working tool. That’s why it’s important to understand which key sales metrics actually help manage results, and which ones merely create the illusion of control.

In this article, we’ll examine how to select truly important metrics while avoiding information overload. It will be useful for sales managers, business owners, and analysts who want their reports to bring real value.

Why Select Specific Metrics for Reporting Instead of Including Everything

The human brain has a limited ability to process information. Research shows that we can effectively keep only 5-7 elements in working memory at once. When a manager sees 15-20 different indicators in a report, their attention becomes scattered, and their decision-making ability decreases. Instead of a clear understanding of the situation, cognitive overload occurs – a state in which the brain simply refuses to process excessive information.

Another important aspect is the cost of maintaining metrics. Each indicator you track requires resources: time for data collection, system configuration, accuracy verification, and visualization creation. Teams spend hours preparing reports that no one reads carefully. Resources spent on excessive reporting could be directed to other tasks directly affecting sales growth.

Overloaded reports aren’t just useless – they can be dangerous for decision-making. The phenomenon known as “analysis paralysis” occurs when an excess of data leads to postponing decisions or their complete absence. A manager seeing dozens of contradictory indicators begins to doubt and loses the ability to act decisively. Worse yet, in a mass of indicators, it’s easy to select only those that confirm existing beliefs, ignoring data that contradicts them.

There is a direct connection between focusing on key metrics and actual sales growth. Companies that track 3-5 key metrics for reports demonstrate higher growth rates than those trying to control everything at once. When the entire team understands which sales performance metrics are truly important, a unified direction of effort emerges. Salespeople know what to focus on, managers can quickly identify problems and opportunities, and decisions become more consistent and effective.

As Peter Drucker said: “You can’t manage what you can’t measure.” But we can add: “You can’t effectively measure everything simultaneously.” By choosing fewer metrics but with greater meaning, you create conditions for focused improvement of results. When a team’s attention is directed to several key indicators instead of dozens of secondary ones, growth of these indicators becomes more likely and sustainable.

In B2B sales, the focus of key metrics shifts toward funnel quality and managing the long sales cycle. Here, important metrics include: Pipeline Value, conversion between funnel stages, Sales Cycle Length, win rate, average deal size and customer profitability, as well as LTV and repeat sales percentage. For complex corporate sales, it’s critical to track not just revenue, but the funnel structure: how many qualified opportunities are created, how many decisions are made, where deals get “stuck,” and which segments provide the greatest return. These metrics that influence sales allow you to manage predictability and growth rate, not just record the final result.

In B2C sales, the priority shifts to speed, volume, and conversion efficiency at each customer touchpoint. The main metrics here are traffic and its quality, conversion rate (CR), customer acquisition cost (CAC), average order value, revenue per user (ARPU/ARPPU), purchase frequency, and retention rate. In retail and e-commerce, it’s also critical to track product margins and inventory turnover. If in B2B the key question is “how to manage the deal and relationships,” then in B2C it’s “how to manage flow and conversion.” Accordingly, the reporting system should be built around metrics that directly affect the scalability of the model and the unit economics.

It’s important to understand that there is no universal set of metrics. Depending on the niche, business model (subscription, project sales, distribution, e-commerce), sales cycle length, and the current situation in the sales department, priorities will differ. A startup in the aggressive growth stage will focus on the number of new opportunities and scaling speed, a mature company on margins and retention, and a department with declining conversion on funnel quality indicators and work with stages. Metrics should not be selected according to a template “like everyone else,” but based on the specific goal of the business and the growth point of your sales department. Only in this case will reporting become a management tool rather than a copy of someone else’s dashboard.

Now let’s look at what principles to follow when selecting metrics for your reporting.

Principles for Selecting Key Metrics for Reports

For reporting to become a real management tool rather than a formality, each metric included must meet several fundamental criteria. These principles will help you separate truly important indicators from those that only create information noise. Properly selected key metrics for reports allow you to transform data into a management tool, not a formal set of numbers that no one uses for decision-making.

The first and perhaps most important principle: a metric should influence decisions. Ask yourself: “What management decision will I make if this indicator changes?” If there’s no clear answer, perhaps this indicator shouldn’t be included in the main reporting. For example, if the number of manager calls drops by 30%, you’ll likely have a meeting with the team to understand the reasons. But if the average conversation time decreases from 7 to 6 minutes – will this lead to any specific actions? If not, this indicator can be left for deep analysis but not for regular reporting.

The second principle: the metric should be manageable. Indicators that the team cannot directly or indirectly influence often create frustration and demotivate. For example, the total market size is an important indicator, but in the short term, the sales team can do little to change it. Meanwhile, conversion from lead to deal is an indicator that managers can directly influence by improving their sales skills and objection handling.

The third principle: the metric should be interpretable. The team should understand what changes in the indicator mean and how to evaluate them. Overly complex composite metrics or those requiring special knowledge for interpretation rarely become effective management tools. For example, the “average check” metric is clear to everyone, but an “index of product penetration into the customer base considering seasonal fluctuations” will raise questions for most employees.

The fourth principle: the metric should be linked to business goals. Each tracked indicator should have a clear connection to what the company is trying to achieve. If your goal is to increase profitability, then sales volume without considering margins may be an incomplete indicator. If the focus is on growing market share, then the number of new customers may be more important than the average check. Let’s examine this principle in more detail.

How often do you drown in reports but still can’t determine exactly where your sales department is losing effectiveness? According to research, 70% of companies collect an excessive number of metrics that ultimately don’t lead to specific decisions. This is a typical situation that most business owners face when trying to set up a reporting system independently.

At “Sales Rocket,” we’ve developed a methodology for building a transparent and effective metrics system that focuses not on the quantity of indicators, but on their practical value for decision-making. Our experts conduct a deep analysis of your sales department, identifying key points requiring control, and configure your CRM system to automatically collect only meaningful data. As a result, you get a reporting system that allows you to quickly identify problems and make management decisions based on clear and understandable information.

Our approach to building a metrics system has already helped 187 companies across 14+ different industries increase their average revenue growth by 35%.

Transform reporting from bureaucratic formality into a working tool - order a free audit of your metrics system!

Linking Indicators to Business Goals

One of the most common mistakes in building reporting is the gap between what is measured and what the business is actually trying to achieve. For example, if the company’s goal is revenue growth, simply increasing the number of leads may not lead to the desired result. Low-quality leads, even in large quantities, usually don’t convert into sales and can even be harmful by diverting resources from more promising clients.

To ensure that a metric is truly linked to a business goal, conduct a thought experiment: imagine that the indicator has increased significantly. Will this bring the company closer to its strategic goals? For example, if the number of presentations doubled but they’re conducted for a non-target audience, this is unlikely to lead to sales growth. But if the number of presentations for clients matching your ideal customer profile has increased, the likelihood of increased sales is much higher.

You can also verify the connection between a metric and the ultimate goal through historical analysis. Study how your key business indicator (e.g., revenue) changed depending on changes in presumed leading metrics. If a 20% increase in manager activity resulted in only a 1% revenue increase, perhaps this metric doesn’t influence the result as strongly as you thought.

Remember that the connection between a metric and business goal can change over time or depending on the context. What worked during a startup’s rapid growth stage may be less relevant for a mature company focusing on profitability. Regularly review these connections and don’t be afraid to abandon indicators that have lost their predictive power.

Level of Metric Manageability

One of the most dangerous types of metrics in reporting are those provided “for information” but don’t imply specific actions. Such indicators create the illusion of control but in practice only clutter reports and dilute the team’s attention. When managers see a metric in a report but don’t understand what to do with it, cognitive dissonance arises: the indicator seems important (otherwise why track it?), but how to influence it is unclear.

For example, “total market size” is an indicator that’s useful to know for strategic planning, but the sales team cannot change it through their daily actions. Including such a metric in monthly reports will only make managers feel helpless in the face of factors beyond their control.

What to do with indicators that cannot be directly influenced? You have several options. First, you can exclude them from regular reporting, keeping them for strategic reviews or contextual analysis. Second, you can transform an unmanageable metric into a manageable one, focusing on aspects that the team can control. For example, instead of “market share” (a macro indicator), you can track “share of deals won against competitors” (a micro indicator).

Another approach is to use unmanageable metrics as context for interpreting manageable indicators. For example, if overall market demand fell by 30% due to seasonal factors, but your sales decreased by only 10%, this can be considered a relative success. In this case, the unmanageable metric (market volume) helps correctly interpret the manageable one (sales volume) without creating false expectations.

Remember that ultimately, reporting should expand your team’s capabilities, not create a sense of helplessness in the face of uncontrollable factors. Choose metrics that can be influenced by specific actions, and you’ll see how employees’ attitudes toward reports change – from formal responses to a working tool.

How to Properly Select and Configure Metrics for Your Department

Metrics should not only be collected but also really help make decisions. Often companies fall into a trap by creating impressive dashboards that no one uses to improve the business. To avoid this, you need to carefully approach the selection and configuration of indicators. At this point, a manager naturally wonders: which indicators to include in reporting so they actually influence management decisions rather than just increasing the volume of data?

Start by evaluating selected sales KPIs for “vanity” (vanity metrics). These are indicators that look impressive but have little impact on real business results. A classic example is the number of social media followers without analyzing their conversion to customers. In sales, such metrics might be the total number of calls without assessing their quality or conversation duration without evaluating effectiveness. Real sales KPIs for reporting are always connected to ultimate business goals and help make decisions. Sales KPIs for reporting should be formulated in a way that allows quick assessment of the department’s condition and making specific management decisions.

Ask yourself: if this indicator increases but all others remain unchanged, will this be a success for the company? If the answer is “no” or “not sure,” you might be looking at a vanity metric. For example, increasing the number of meetings that don’t lead to deals is not a real success, although it looks like increased activity in the report.

It’s important to balance leading and lagging indicators. Lagging indicators, such as revenue or profit, show the results of past actions. They’re important for evaluating overall effectiveness, but when you see them, it’s already too late to change anything. Leading indicators, such as the number of quality leads or sales funnel fullness, allow you to predict future results and make timely adjustments.

The ideal set of metrics includes both types of indicators: lagging – to know if you’re achieving goals, and leading – to understand if you’re on the right track. For example, if your department tracks only sales volume (a lagging indicator), you’ll learn about problems too late. By adding “number of new opportunities in the funnel” (a leading indicator) to your reporting, you can anticipate problems weeks or months before they affect revenue. A deeper understanding of where deals are being lost and which stages need optimization is provided by systematic sales funnel analysis, which helps identify bottlenecks and improve overall department conversion.

One of the most important focusing tips – limit the number of priority reporting metrics on your dashboard to 3-5. This seems radical, but psychological research shows that a person cannot effectively track more indicators simultaneously. Choose truly critical metrics that influence sales, directly linked to your goals, and make them the center of attention. Other indicators can remain in secondary reports for deep analysis, but don’t overload the main dashboard with them. The focus should remain on metrics that influence sales – indicators whose changes directly reflect on revenue, margins, or deal closing speed.

In real practice, excessive detail often prevents seeing the big picture. One of our clients, a large distributor, prepared a monthly report with sales broken down by 50 product categories. Management spent hours analyzing fluctuations in each category but missed the overall trends. When they reduced the main report to 5 key categories and an overall indicator, the quality of decisions improved significantly, and analysis time decreased from 3 hours to 20 minutes.

Another example – an IT company that tracked 12 different sales funnel indicators. Managers got lost in the data and couldn’t determine what to focus on. After reviewing their reporting, they kept 3 critical indicators: conversion from lead to opportunity, average deal closing time, and successful closure rate. As a result, the team became more focused, and results improved because everyone understood which indicators to include in reporting were truly important.

Remember, the goal of reporting is not to collect all possible data, but to provide information that helps make better decisions. Each time you add a metric to a report, ask yourself: how will this information change my actions? If there’s no clear answer, perhaps this metric is unnecessary.

How to Know if Metrics are Chosen Correctly

The effectiveness of a metrics system can be determined by several key signs. The main one is that reports lead to specific decisions. If after reviewing reports you regularly make informed decisions about adjusting strategy, reallocating resources, or changing processes, then your metrics are working. Conversely, if reports only provoke general discussions without specific conclusions, you might be tracking the wrong indicators.

A telling example: one company prepared a detailed weekly report on manager activity (number of calls, meetings, presentations), but no actions were taken based on this data. After revising their metrics system, they began tracking not only the quantity but also the quality of interactions – what percentage of calls lead to meetings, what percentage of meetings convert to proposals. This data immediately began influencing management decisions – from script adjustments to training program revisions. Ultimately, properly configured indicators directly influence sales plan fulfillment, as they allow timely identification of deviations and correction of team actions before the decline becomes critical. More about the systematic approach to sales plan fulfillment can be found in a separate article.

Another important sign of correct metric selection – reports are actually read, not “filed away.” When managers and the team show genuine interest in reporting, discuss indicators, and ask questions, this indicates that metrics are perceived as a valuable source of information. If reports are created only because “that’s how it’s supposed to be” and no one shows interest in them, it’s worth reconsidering the set of indicators.

Properly selected metrics help find growth points – another sign of an effective system. By analyzing data, you should regularly discover new opportunities for improvement: promising customer segments, more effective acquisition channels, products with sales growth potential. If your reporting only confirms what you already know without revealing new perspectives, it may not be informative enough.

It is based on correctly chosen metrics that effective strategies for improving sales performance are formed, as data allows determining which process stages need strengthening and where the greatest growth potential is hidden. Read more about practical strategies for improving sales performance in a separate article.

For example, a company selling construction materials included in its reporting not only segmentation of sales by products but also by customer types. This revealed that small contractors, who were previously not given much attention, showed stable growth and high margins. As a result, a special department was created to work with this segment, leading to a significant increase in profits.

Good metrics also create healthy competition within the team. When sales reporting metrics are understandable, measurable, and perceived as fair, they stimulate employees to improve results. If managers in your company actively monitor their indicators and strive to improve them, this is a sign that the metrics are chosen correctly.

Finally, the right metrics don’t cause resistance from the team. If employees consider priority reporting metrics adequate and fair, they are more likely to strive to improve them. Dissatisfaction with the metrics system often indicates that indicators are chosen incorrectly, don’t reflect employees’ real contribution, or don’t take into account important aspects of work.

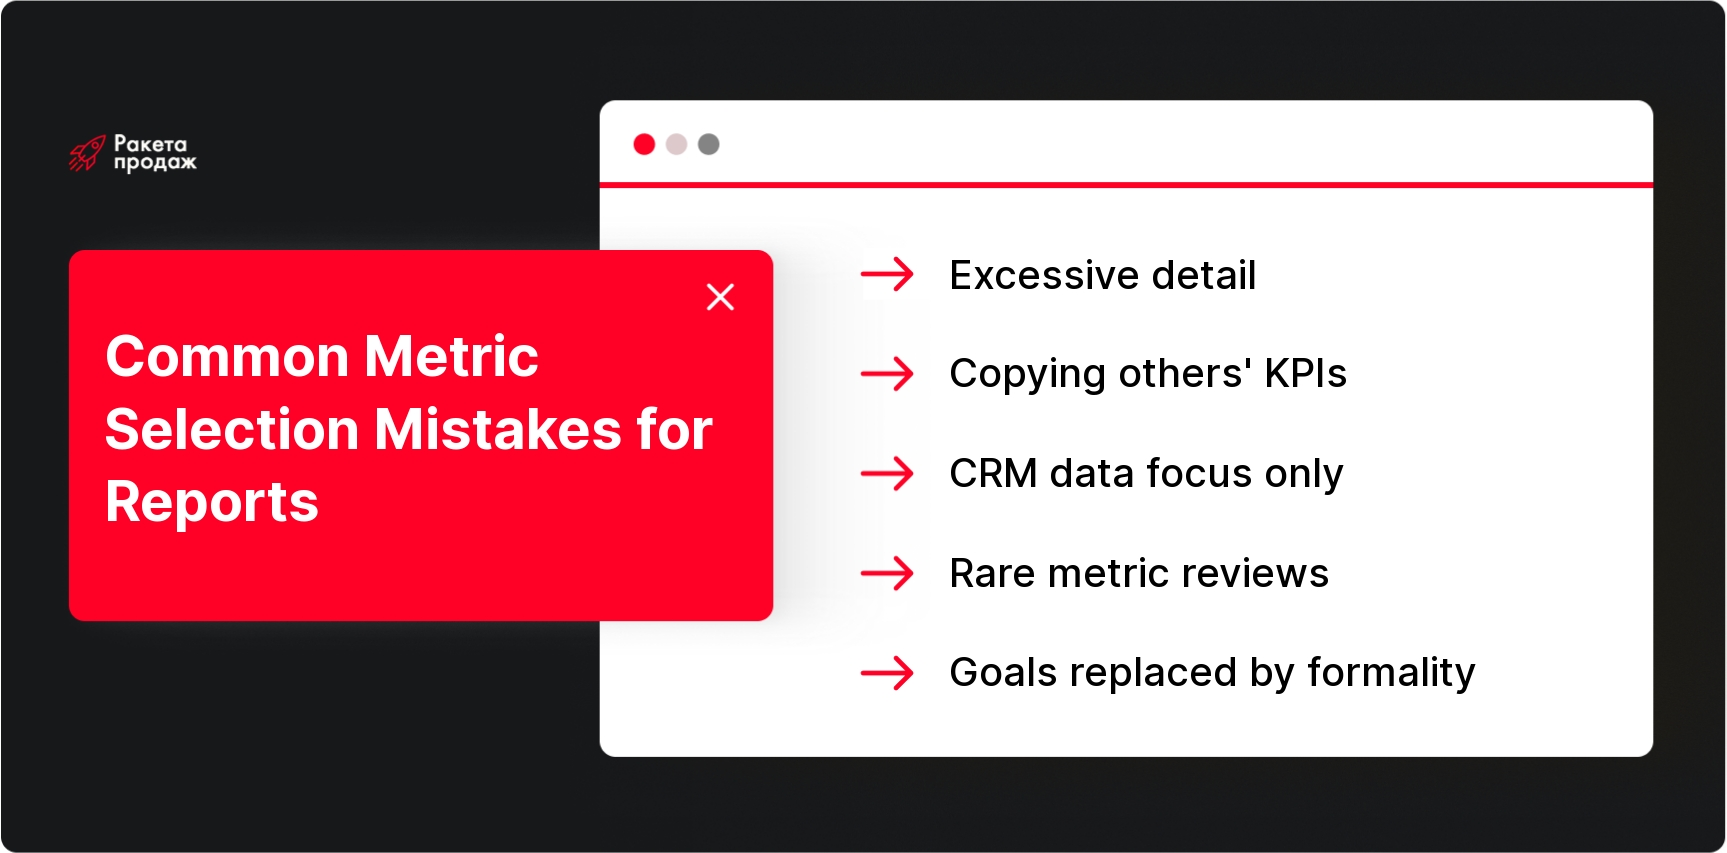
Typical Mistakes When Selecting Reporting Metrics

image

When creating a reporting system, companies often make mistakes that reduce the effectiveness of the entire process. Understanding these mistakes will help you avoid common traps and create a truly working metrics system.

One of the most common problems is excessive detail. Companies try to track every aspect of activity, creating cumbersome reports where it’s impossible to highlight what’s important. For example, a sales department of a large equipment manufacturer tracked sales broken down by 30 models, 15 regions, and 10 customer types. As a result, the monthly report contained more than 4500 indicators, and no one could draw clear conclusions from it. The solution was to create a summary report with 7 key metrics of the sales department, with the ability to delve into details when necessary.

Excessive detail creates the illusion of control but in practice leads to “analysis paralysis” – a state where decisions are delayed due to information overload. Remember the rule: the more metrics you track, the less attention each one receives. Focus on indicators directly related to your strategic goals.

Another common mistake is copying others’ KPIs without adapting them to your business specificities. Often companies implement sales reporting metrics that work successfully for competitors or are described in business literature without considering how relevant these indicators are to their own situation. For example, a SaaS company implemented the “average check” metric following a retailer’s example, although for a subscription model, retention and customer lifetime value indicators are much more important.

Every business is unique, and the metrics system should reflect its specifics, development stage, business model, and strategic goals. Before implementing a metric, ask yourself: “How is this indicator related to our specific goals? Does it work in our context the same way it does in other companies?”

Focusing only on CRM data is another typical mistake. Modern CRM systems offer many built-in reports, and it’s tempting to limit yourself to just these metrics. However, CRM data reflects only part of the picture. They show manager activity and deal status well, but often don’t account for qualitative aspects of customer work, marketing campaign effectiveness, or market trends.

An industrial equipment manufacturing company relied exclusively on CRM reports and was surprised when sales fell despite high manager activity. Only after integrating data from other sources did they discover that the cause was a sharp price increase by competitors, which needed to be responded to. A comprehensive metrics system should include data from different systems: CRM, marketing platforms, financial reports, customer satisfaction surveys. Learn more about correct integration and CRM implementation for sales to get a complete picture.

Lack of metric review is a serious problem even for companies with initially good reporting systems. The business environment constantly changes, and indicators that were critically important a year ago may lose relevance. For example, during a company’s rapid growth period, metrics for attracting new customers are important, but as the market saturates, the emphasis should shift to retention and development of existing customers.

It’s recommended to review the metrics system at least once a year, and preferably every quarter, asking questions: “Are all these indicators still related to our strategic goals? Are we missing any important aspects? Are we tracking indicators by inertia, although they no longer influence decisions?”

Remember that the goal of reporting is not data collection for its own sake, but decision support. If a metric doesn’t help you make your business better, perhaps it should be abandoned, no matter how popular it may be.

Building an effective metrics system is not just a technical process but a strategic task requiring a deep understanding of business processes and company goals. Implementing the principles described in the article can significantly improve the quality of your management decisions, but for maximum effect, it’s worth consulting experts.

“Sales Rocket” offers a comprehensive solution for creating a transparent reporting and metrics system in your business. We don’t just configure reports in CRM but create a holistic sales management system that includes key performance indicators, dashboards for managers, and tools for daily monitoring of manager results. Our approach is based on individual analysis of your business and selection of only those metrics that truly influence decision-making.

“Sales Rocket” clients receive not just a set of reports, but a system that automatically identifies problems in the sales process and suggests where intervention is required. This approach allows reducing data analysis time from several hours to 20 minutes and focusing the team’s attention on truly important indicators.

Our methodology for implementing a metrics system has already proven its effectiveness in working with companies such as Mitsubishi, Yamaha, and Naftogaz, ensuring stable achievement of 150% of the sales plan monthly.

Create a metrics system that transforms data into profit - order a consultation on building effective reporting!

Conclusion

Building an effective metrics system is balancing between information completeness and its practical applicability. As we’ve seen, fewer metrics often means more management, as focus on key reporting metrics allows making more informed and timely decisions. Overloaded reports create the illusion of control but in practice make it difficult to understand the real situation and identify growth points.

Instead of trying to track all possible aspects of activity, focus on sales performance metrics that are directly related to your business goals, are manageable, and lead to specific actions. Remember: a good report is not one that contains maximum information, but one that allows you to make the right decision.

Start rebuilding your reporting with a sales department audit. Ask three questions for each indicator: “What decision will I make if this indicator changes?”, “How is this indicator related to our strategic goals?”, and “Can we influence this indicator with our actions?” If there’s no clear answer to any question, perhaps this metric should be excluded from the main report or moved to secondary ones.

Create a hierarchy of reports: a main dashboard with 3-5 key metrics for regular monitoring, detailed reports for in-depth analysis on request, and strategic reviews for tracking long-term trends. This structure allows maintaining focus on the main things without losing access to detailed information when needed.

And finally, remember that a metrics system is a living tool that should evolve with your business. Regularly review indicators, abandon those that have lost relevance, and add new ones if they better reflect current priorities. Only this way will reporting transform from bureaucratic formality into an effective management tool that truly helps your business grow.

In this article:
See more
Book a FREE sales funnel audit
CONTACT US
FAQ
What's the difference between KPIs and reporting metrics?

KPIs (Key Performance Indicators) are metrics directly linked to an organization’s strategic goals and used to evaluate success. Reporting metrics are a broader concept, including all measurable indicators. Not all metrics are KPIs, but all KPIs are metrics. For reporting, it’s important to choose indicators that truly reflect progress toward your business goals.

Which metrics most often overload sales reports?

Reports are most often overloaded with detailed activity indicators (number of calls/emails by each manager daily), excessive sales segmentation (by multiple categories simultaneously), and “vanity metrics” that look impressive but don’t influence decisions. The problem of duplicating similar indicators with small variations is also common.

Should the same metrics be used for all reports?

No, metrics should correspond to the specific report’s goals and its audience. Strategic indicators (profit, market share) are important for company management, tactical ones (conversion, sales funnel) for the sales department head, and operational ones (number of meetings, active deals) for managers. Use different sets of indicators for different management levels.

How to know if reporting metrics are chosen correctly?

Properly chosen metrics lead to specific decisions and actions. If after reviewing a report you regularly adjust strategy, reallocate resources, or change processes, your metrics are working. Other signs: reports generate lively interest from the team, help discover new growth opportunities, and don’t face resistance from employees.

How often should reporting metrics be reviewed?

It’s recommended to review the metrics system at least once a year, and in a rapidly changing business – every quarter. Reasons for review: changes in the company’s strategic goals, launching new products, entering new markets, changes in the business model or company development stage. It’s also worth analyzing which metrics are actually used for decision-making and which just take up space in reports.

SUBSCRIBE TO MY TELEGRAM CHANNEL
The most valuable sales information right on your phone!
icon

LOTS OF USEFUL INFORMATION, FREE TEMPLATES, AND CHECKLISTS ON MY INSTAGRAM

Materials and practical advice on sales growth in our blog: