icon

How Automated Plan-Fact Reports Help You Spot Sales Drops Faster

The twenty-fifth of the month. The manager opens the CRM or spreadsheets and sees: 40% short of plan. The whole time, the team was working – calling, meeting, sending proposals. But there’s no result. The post-mortem begins, but there are only five working days left, and it’s almost impossible to change the month’s outcome. Sound familiar?

Want a high-performing sales team without the hassle?
We’ll build it for you.
Contact Us

Key Takeaways

  • Sales drops usually only become visible at the end of the month, when it’s too late to fix anything, because managers look at final revenue instead of leads, calls, and stage-by-stage conversion.
  • An automated plan-fact report highlights deviations earlier than a human would notice them and shows the exact point in the funnel where problems began (lead shortage, slower request processing, dropping conversion).
  • The manual approach eats up hours pulling data from CRM, spreadsheets, and ad accounts, and by the time the report is ready, the numbers are already outdated.
  • Automation without CRM data discipline just shows chaos faster instead of solving the problem, if reps enter data haphazardly.
  • The benefit isn’t just for the manager: the rep gets transparent rules of the game, sees their own distance to plan and bonus, and stops wasting time on manual reports.
  • Plan-fact only works when someone is accountable for each deviation and the team regularly reviews the numbers, rather than just glancing at a dashboard once a month.

The full article will show how to set up automated plan-fact analysis in your sales department, which metrics to track, and how to build the report into a regular management process. Read on below 👇

The most frustrating part is that the problem is almost never a lack of data. The data exists: it’s sitting in the CRM, in the phone system, in the ad accounts, in the sales manager’s spreadsheet. The problem is that nobody checks it against the plan on time and in the right breakdown. A lag that could have been spotted on day five of the month by the number of new leads only surfaces on day twenty-five – already as a revenue shortfall.

Automated plan-fact reports – often referred to as automated plan vs actual reports – solve exactly this problem. They constantly compare plan to actual, flag deviations before a human would notice them, and highlight exactly where in the funnel the drop began. Let’s break down how this approach differs from manual analysis, how it’s built technically, and what specific benefit both the manager and the individual rep get from it.

How Automated Plan-Fact Analysis Differs From Manual Analysis

With the manual approach, the sales manager pulls data from the CRM, spreadsheets, ad accounts, and phone system every week – sometimes every day. Someone exports a report by rep, someone consolidates the numbers into a separate file, and then checks them against the plan. This takes hours, sometimes days. By the time the report is ready, the data in it is already outdated, and one error in a formula can easily distort the whole picture.

Automated plan-fact analysis, also known as automated plan vs actual analysis, works differently. Data is pulled automatically from the CRM, phone system, website forms, and ad accounts, without human involvement. Metrics update on a schedule or nearly in real time, and deviations from plan are visible immediately, without extra calculations. The difference isn’t that the report looks nicer. The difference is in the speed of management response: the earlier a manager sees a drop, the more time they have to act on it.

And this is where it’s worth taking a closer look at exactly what benefits reporting automation brings to a business.

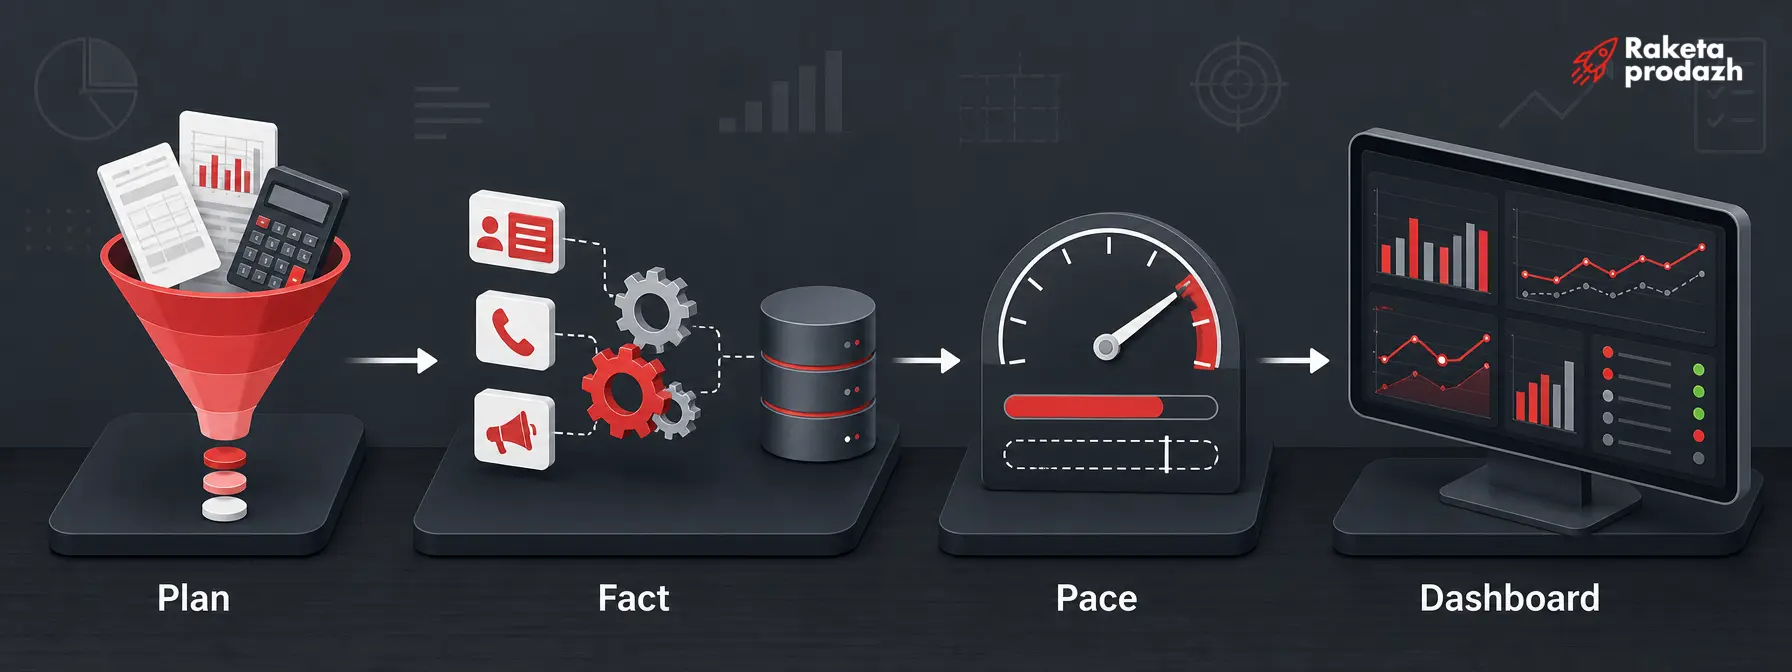
How It Works Under the Hood: Four Steps From Plan to Dashboard

A live plan-fact system isn’t a single button in the CRM – it’s a chain of four elements. Each one handles its own job, and without any single one of them, the system stops being a management tool.

Step 1. The plan is born in a calculation, not in someone’s head

Most plans are set like this: “last month we did $3 million, let’s do $3.5 million this month.” A plan like that can’t be controlled in the moment, because it isn’t broken down into actions. A proper plan is built by reverse-engineering the funnel: from target revenue to number of deals, from deals through stage conversion rates – to number of meetings, qualified leads, and initial inquiries.

The number is then distributed not just “across the month,” but across working days: accounting for each rep’s schedule, vacations, sick leave, and public holidays. That’s precisely why we built planning as a separate web tool: the manager sets the goal and conversion rates, and the planner calculates the funnel backward on its own, breaking the plan down by rep and by day. From that point on, the plan is no longer a file in someone’s folder – it’s a line in the system, right next to which the actual figure automatically appears.

Step 2. The actuals are collected without human involvement

Deals, amounts, stages, sources, calls, tasks, and ad spend are pulled from the CRM and external services automatically – via integrations and data exchange scenarios. The data lands in a single repository, where the rules the team agreed on in advance are applied to it: what counts as a qualified lead, at what stage a deal enters the forecast, how to account for returns and repeat purchases.

The key point: it’s not a person or a formula in someone’s spreadsheet doing the counting – it’s the system, consistently, every day, with no room for interpretation.

Step 3. What’s compared is pace, not just the final outcome

This is the main difference between a live plan-fact system and a classic report. The system knows that today, for example, is working day twelve of twenty-one, which means about 57% of the plan should be closed by now. If only 38% is actually closed, the deviation is visible today – not on the thirtieth. The “pace relative to plan” metric turns an annual or monthly goal into a daily reference point for the whole team.

Step 4. All of this feeds into a dashboard, not a chat thread

The final layer is visualization in a BI system (for example, Data Studio): plan-fact metrics broken down by day, week, month, or quarter, with deviation, pace, and forecast all on one screen, sliced by rep, business line, lead source, and period. Green marks what’s on track, red marks what’s slipping. Each role has its own screen: the rep has their personal one, the department head has the team view, the owner has the company-wide summary.

This kind of sales department analytics and dashboards work on an “open it and understand it in 30 seconds” basis, not “export, consolidate, double-check.”

four steps of plan-fact — Four stages of automated plan-fact analysis from plan to dashboard

Know that feeling when the month is almost over and the plan is glowing red on the screen? And only now do you realize something went wrong somewhere in the funnel, but there’s no time left to fix it? This is a classic problem for most companies – the lack of operational plan-fact analytics that flags the problem while there’s still time to act on it.

At “Rocket Sales,” over 8+ years we’ve helped 208 companies build exactly these kinds of reporting systems: where plan and actual are compared not at the end of the month, but every day, so you can see exactly where in the funnel problems started. We set up live dashboards that pull data from CRM, phone systems, and ad accounts automatically, and deviations get flagged before they turn into a serious drop.

Our clients’ average revenue growth is +35%, and the best result was +$10,907,403 over 4 months of work.

Turn your sales into a managed system with transparent analytics - get a free sales department efficiency audit!

What Plan-Fact Automation Gives Managers and Owners

For leadership, the value of a plan-fact system isn’t measured by the number of charts, but by the quality and speed of decisions. Automation changes the entire logic of working with numbers: instead of a one-time check before a planning meeting, you get a live panel – department analytics and dashboards – that updates constantly and reacts to changes the moment they happen. A company that used to spend two days preparing a weekly report gets it in seconds after implementing a dashboard, and the team spends the freed-up time analyzing the causes of deviations instead of building spreadsheets.

  • Forecast instead of hope. By mid-month, you can already see how the month will close given the funnel’s current state, and there’s time to close the gap.
  • Early signal instead of a post-mortem after the reporting month ends. A pace deviation is visible the same day it appears, not after the period closes.
  • One source of truth. The manager, the CFO, and the owner all look at the same number, and the planning meeting stops starting with an argument over whose report is correct.
  • Channel economics, not just revenue. Right next to the sales plan, you see the ad budget: cost per inquiry and cost per deal for each source. It becomes clear which channel to scale and which to shut down.
  • Evaluating reps by numbers, not by gut feeling. You see not just the result, but the drivers: activity, request processing speed, stage-by-stage conversion.
  • Reduced human error. Manual entry mistakes and “broken” formulas stop affecting management decisions.
  • Freed-up management time. The hours that used to go into building reports go back into working with people and deals.

But the management benefit is only half the picture. The system truly works when the individual rep feels its value too.

What Plan-Fact Gives a Sales Rep

This is where the main implementation risk lies. If a rep sees the dashboard as a control and punishment tool, they start fearing the numbers and fudging the data. If they see it as a tool that helps them earn more, they start monitoring CRM data quality themselves. The difference lies entirely in how the system is built and what’s shown to the rep.

  • A clear picture of the distance to plan and bonus. Not an abstract “you need to sell more,” but something concrete: you’re short by this specific amount, which equals this many deals at your current average deal size.
  • A plan broken down into actions. The rep sees not just a revenue goal, but their daily quota for calls, meetings, and proposals sent – the things they actually control.
  • Zero manual reporting. No need to consolidate results in the evening, post them in a chat, and fill out a parallel spreadsheet for the manager.
  • Money found in your own funnel. You can surface deals that have been sitting too long at one stage or have no follow-up task – this is the fastest source of extra revenue.
  • Protection from unfair complaints. If a channel drops or lead volume falls, it’s visible in the numbers, and “why did you fail” turns into an investigation of the real cause.
  • Transparent rules of the game. Everyone looks at the same metrics, and lead distribution and workload are visible too – leaving less room for grievances.
  • A calmer conversation with the manager. The discussion is built around specific stages and deals, not feelings and memories of last week.

That’s exactly why we always recommend giving reps their own personal dashboards, rather than keeping analytics as a management privilege. A report only the boss sees is treated by the team as surveillance. A report everyone sees becomes a shared tool.

What Kinds of Drops Automated Plan-Fact Reports Help You Catch

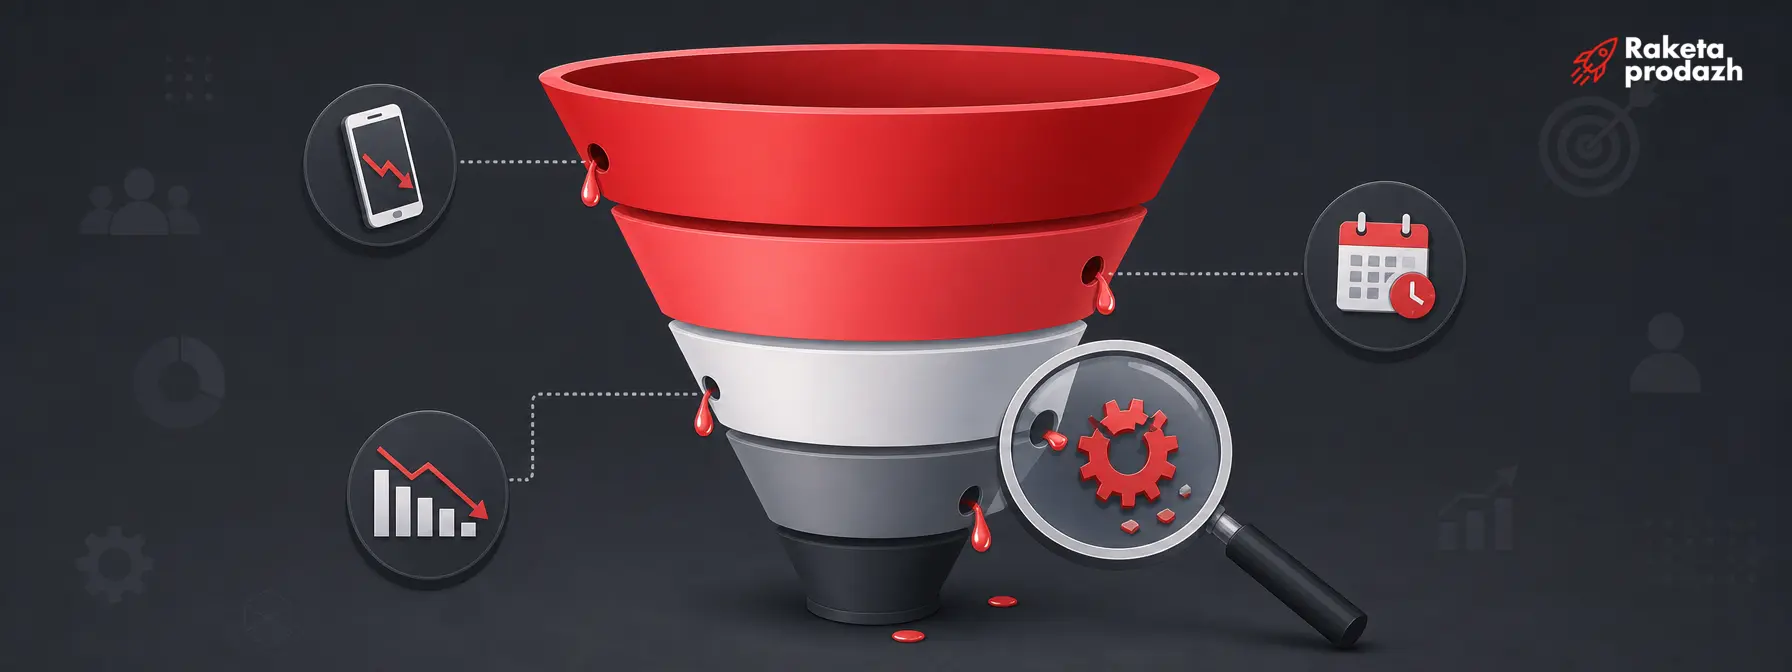
The value of plan-fact analysis isn’t just confirming “the plan wasn’t met.” That’s obvious by the end of the month even without any automation. The real benefit is that the report shows exactly where the problem originated, while there’s still time to fix it. A revenue shortfall can stem from a dozen different causes, and without a breakdown by stage, rep, and source, the manager is just guessing what to fix.

An automated report breaks the overall picture down into specific risk zones. You might see that it’s not revenue itself that dropped, but the number of new leads from a particular channel, or that reps have gotten slower at processing requests. This allows for targeted responses instead of overhauling the entire sales strategy because of one weak week.

  • Revenue shortfall and a lag behind the sales forecast on a specific date within the month.
  • Decline in new lead flow or drop in conversion at specific funnel stages.
  • Rising cost per inquiry and cost per deal at the same ad spend level.
  • Slower team response: longer request processing times, fewer calls and meetings.
  • A drop tied to a specific lead source, or declining metrics for a specific rep.
  • Growing number of overdue tasks and lower overall activity in the CRM funnel.
  • Shrinking average deal size, fewer proposals sent, or more rejections at a specific stage.
  • A drop in the share of repeat customers – a quiet decline that’s almost impossible to notice in time by looking at overall revenue.

For the report to actually catch these signals, you need to properly set up the data collection logic and the rules reps follow in the CRM.

sales dips — Sales funnel with leaks at different stages showing where dips occur

How to Set Up an Automated Plan-Fact Report

Setup doesn’t start with choosing reporting software – it starts with defining the plan. You need to decide which metrics you’re planning for: revenue, number of deals, leads, meetings, and activity for each rep. Next, the CRM funnel needs to reflect actual sales stages, not some abstract scheme from a five-year-old presentation. If the stages are blurry, plan-fact conversion analysis will be useless, because it’s unclear where one step ends and the next begins.

Then comes the technical part: mandatory fields, linking leads to sources, setting up tasks and statuses, and defining who’s responsible for each deal. This is also where you connect the phone system, website forms, ad accounts, and other necessary data sources. The final touch is dashboards with the right update frequency and clear rules for interpreting deviations: what counts as critical versus what falls within normal fluctuation.

  • Define plans for revenue, deals, leads, meetings, and rep activity.
  • Set up the funnel and mandatory fields so each stage reflects an actual sales step.
  • Break the plan down by reverse-engineering the funnel and distribute it across working days and people, rather than “for the whole month” as one lump.
  • Link leads to sources and assign owners for each deal.
  • Connect phone systems, CRM, ad accounts, and any other necessary external data sources.
  • Set up dashboards with the right update frequency and clear rules for interpreting deviations.

There’s an important point people often forget. An automated report is only useful when data is entered into the CRM with discipline. If reps fill out cards haphazardly, the report just automates that same chaos and shows it faster – it doesn’t solve the problem.

A separate question is how often such reports should actually be updated.

How Often to Update Plan-Fact Reports

Update frequency depends on the sales pace in your niche. For businesses with a short deal cycle – retail or fast B2C sales – plan-fact should be checked daily: a deviation noticed a week later is already too late to fix. For B2B with a long cycle, a few times a week is enough, but you still need to regularly monitor the funnel’s state and the next step for large deals that drag on for months.

It’s useful to split control levels by role. A daily dashboard covers operational deviations and is needed by reps and line managers. A weekly report builds the picture for the sales manager and owner. A monthly plan-fact report serves strategic conclusions: revisiting plans, allocating budget, evaluating channel performance. The rule is simple: a report should update often enough that the team still has time to affect the outcome, rather than just record the fact of failure.

Even with the right update frequency, companies often step on the same rakes when implementing this kind of system.

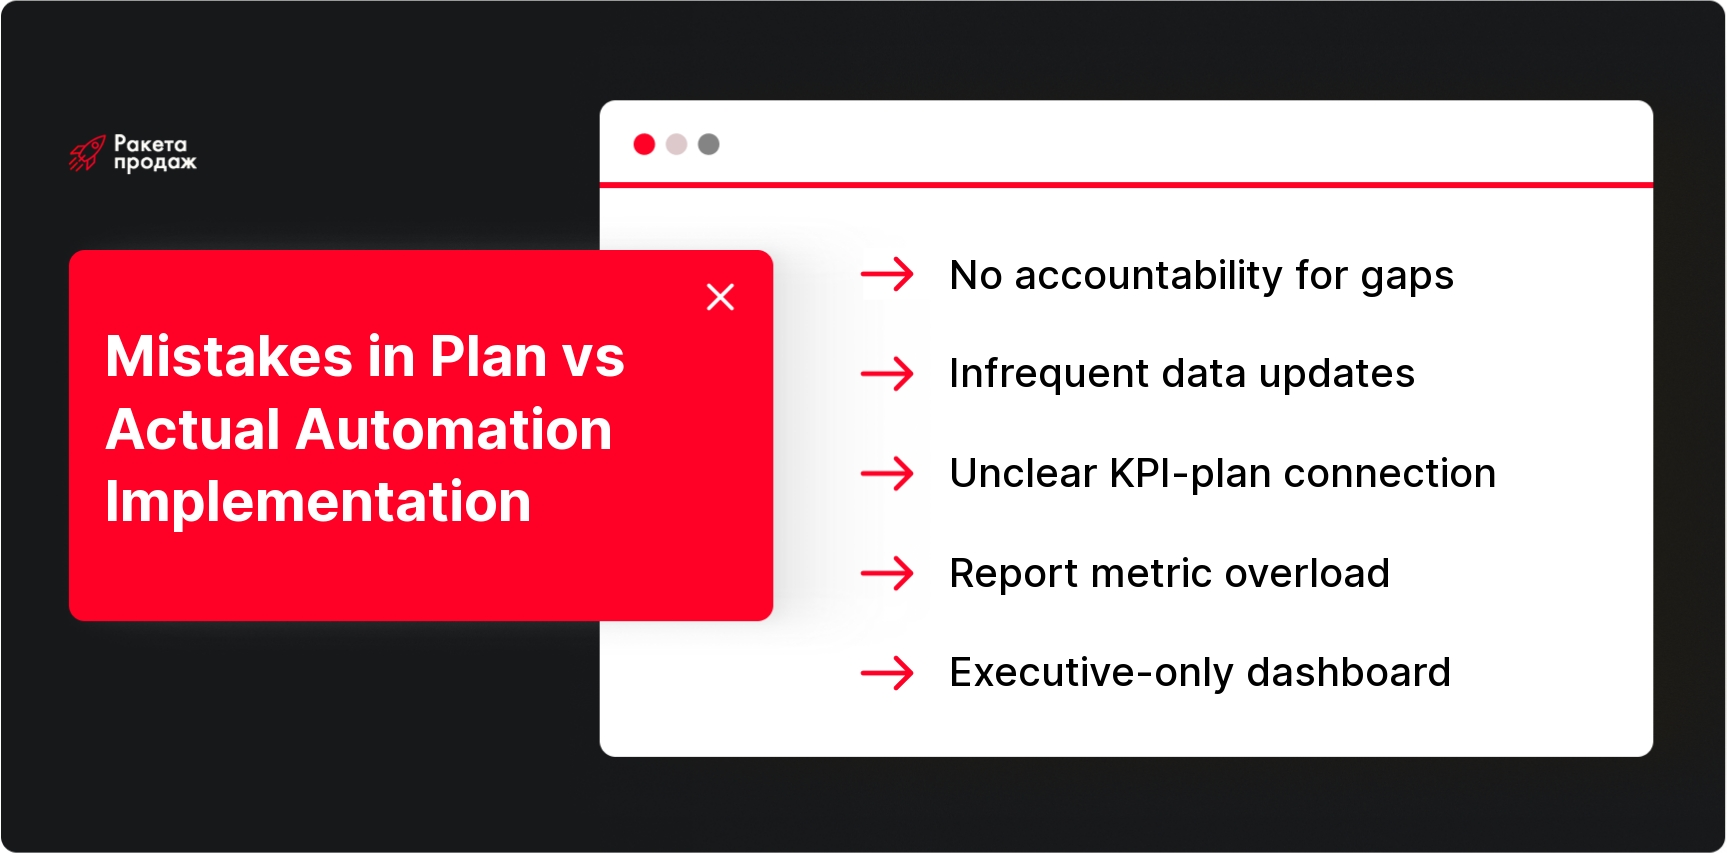
Common Mistakes When Implementing Automated Plan-Fact Reports

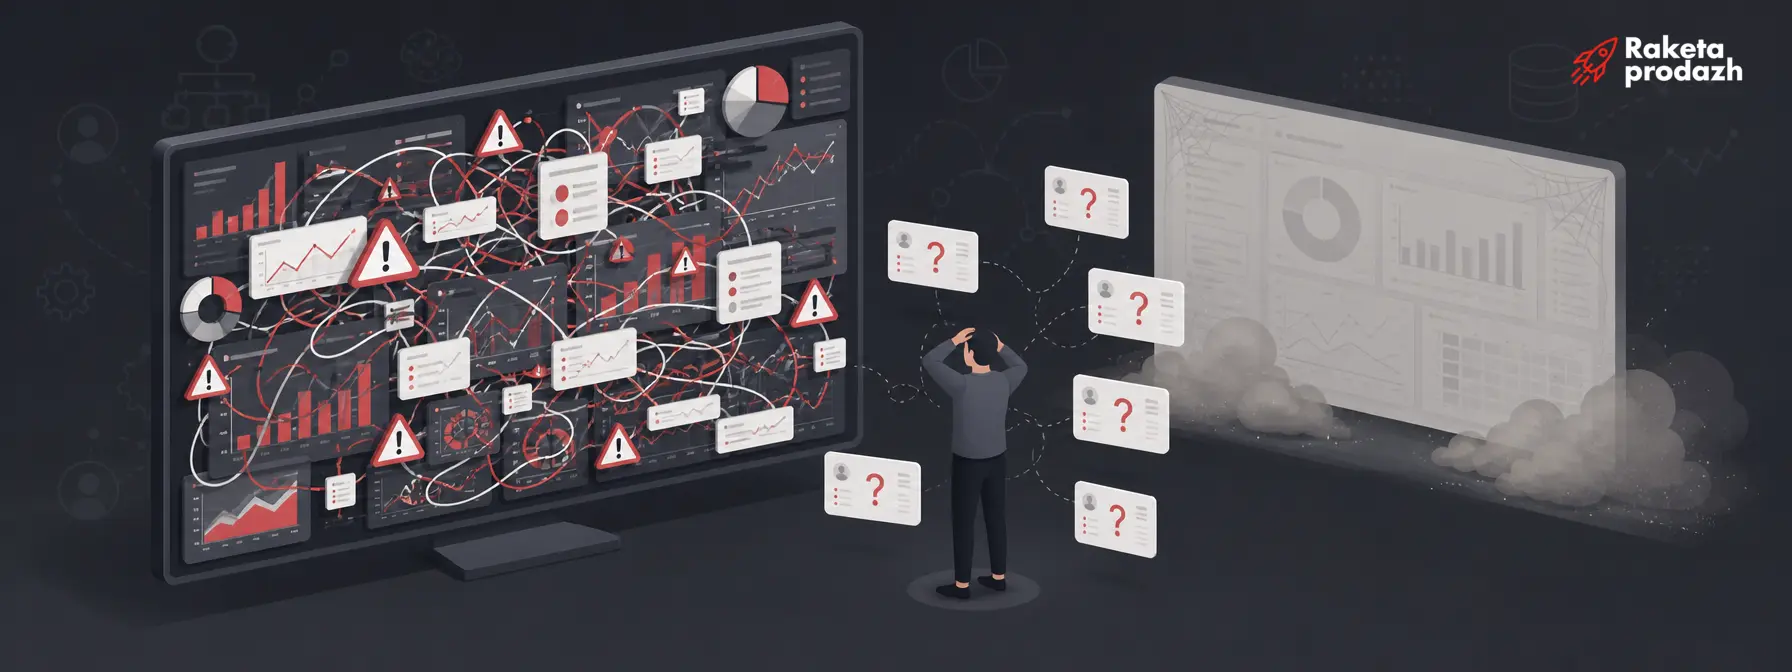
Automation on its own doesn’t fix management problems. It just makes them visible faster – assuming, of course, the report is actually set up correctly. One of the most common mistakes is setting up KPI monitoring without clear goals: the numbers exist, but nobody knows what to do with them. The second most common issue is the lack of unified CRM data-entry rules, which causes reps to interpret the same fields differently.

There are also subtler mistakes. For example, the plan is set only for revenue, without intermediate metrics like number of leads or calls – so the manager only finds out about a problem at the end of the month. Or the report is technically sound but only records the deviation without helping to understand its cause. And quite often, plan-fact is used as a punishment tool rather than a management tool, which causes reps to fear the metrics instead of working with them.

  • No one is accountable for reacting to drops: everyone sees the numbers, but no one is required to act on them.
  • Data updates too infrequently, and the manager, out of old habit, keeps building manual spreadsheets in parallel.
  • Reps don’t understand how their personal metrics affect the company’s overall plan.
  • The report is overloaded with unnecessary metrics, causing important signals to get lost in the noise.
  • The dashboard is only accessible to management – the team doesn’t see its own numbers and doesn’t feel part of the system.

To avoid these pitfalls, it helps to keep a simple implementation checklist in front of you.

plan-fact implementation mistakes — Overloaded chaotic dashboard showing common plan-fact implementation mistakes

Checklist: How to Implement Automated Sales Plan-Fact Analysis

Before connecting any tools, it’s worth clearly defining why you need plan-fact analysis in the first place and which decisions it should support. This isn’t a formality – it’s the foundation for everything that follows: without a clear goal, any dashboard turns into a set of pretty but useless charts.

Next comes the practical work: choosing metrics, setting up or reconfiguring the CRM, connecting data sources, and – most importantly – embedding the report into a regular management process. Below is a sequence of steps you can use as a working implementation checklist.

  • Define the goals of plan-fact analysis and the decisions it should support.
  • Choose key KPIs for revenue, leads, activity, and conversion.
  • Split metrics into outcomes (revenue, deals) and sales drivers (calls, meetings, leads).
  • Set up the CRM funnel so stages reflect the actual sales process.
  • Set plans by period, rep, and business line.
  • Break the monthly plan down by working day, accounting for schedules, vacations, and holidays.
  • Connect data sources: phone systems, forms, ad accounts.
  • Set up mandatory fields without which a deal can’t move forward in the funnel.
  • Automate report updates on a schedule or in real time.
  • Add deviation visualization so problem areas stand out immediately.
  • Define risk thresholds at which a deviation is considered critical.
  • Assign owners responsible for reacting to drops in each area.
  • Implement a weekly plan-fact review with the sales team.
  • Log the actions taken in response to deviations.
  • Regularly check CRM data quality so the report doesn’t lose accuracy.

Automated plan-fact analysis is a powerful tool, but its effectiveness depends directly on how well the entire sales system is set up – from the funnel to CRM data discipline. Attempts to automate chaotic processes often just result in the report showing the same problems faster, without solving them.

“Rocket Sales” builds sales departments “turnkey”: we don’t just set up nice-looking dashboards – we completely rebuild processes, implement CRM systems with automated plan-fact analytics configured in, train the team to work with data, and provide ongoing results monitoring.

Our methodology includes setting up the sales funnel, implementing KPIs and live dashboards for managers, automating reporting, and training reps and managers to work with plans.

Over 8+ years, we’ve built 208 sales departments across 14+ different industries, including work with companies like Mitsubishi, Yamaha, and Naftogaz.

Our clients get predictable sales, consistent plan fulfillment, and a team that runs like clockwork.

Build a sales department with transparent analytics and guaranteed plan fulfillment!

Conclusion

image

Automated plan-fact analysis makes sales manageable: the manager sees plan, actual, deviation, and forecast without manually pulling data from a dozen sources, and the rep sees their own distance to the goal and the specific actions that lead there. But the report itself doesn’t find the drops – it just shows them faster. If a company genuinely wants to cut down its response time to problems, it’s worth not just automating the report, but also thinking through how to build a sales department that operates by unified rules, regularly reviews the numbers, and assigns accountability for every area.

In this article:
See more
Book a FREE sales funnel audit
CONTACT US
FAQ
Why do you need automated plan-fact analysis?

It lets you see deviations from plan in real time, rather than at the end of the month when it’s too late to fix anything. The manager finds the problem area in the funnel faster and has time to act on it, while the team gets a clear daily reference point.

How is an automated plan-fact system better than a manual report?

A manual report is pulled together from different sources by hand, quickly goes stale, and contains errors. An automated one pulls data on its own, updates regularly, and immediately shows deviation, pace, and forecast without extra calculations.

What's the biggest mistake when implementing automated plan-fact reports?

Automating the report without clear metrics and without CRM data discipline. In that case, the system just shows the chaos faster instead of helping to fix it.

What does the individual rep get from such a system, not just the manager?

The rep sees their own distance to plan and bonus, their daily activity quota, and prompts about stalled deals in their own funnel. Plus, they stop wasting time on manual reports, and conversations with the manager are built around facts instead of feelings.

How long does it take to implement plan-fact analytics?

The technical layer is usually set up within a few weeks. What takes the longest isn’t the tech – it’s getting the funnel, CRM data-entry rules, and management rhythm in order. Without that, the dashboard remains just a pretty picture.

SUBSCRIBE TO MY TELEGRAM CHANNEL
The most valuable sales information right on your phone!
icon

LOTS OF USEFUL INFORMATION, FREE TEMPLATES, AND CHECKLISTS ON MY INSTAGRAM

Materials and practical advice on sales growth in our blog: