icon

What Reports a Sales Director Needs at Each Company Growth Stage

Have you ever wondered why some sales directors view reports as a burden, while others see them as their main navigation system? The difference isn’t about loving numbers. The fact is that no universal set of reports exists. A company with a team of three people and a corporation with a hundred salespeople live in fundamentally different realities, and their management tools should differ as much as a bicycle from a Boeing.

Want a high-performing sales team without the hassle?
We’ll build it for you.
Contact Us

Key Takeaways

  • No universal set of reports exists. A startup with three salespeople and a corporation with a hundred managers live in different realities – management tools must match the growth stage.
  • Excessive reporting kills sales as much as its absence. When managers spend more time on spreadsheets than with customers, the system is broken.
  • Weak reports only capture the past (monthly revenue), while strong ones show the future through leading indicators: funnel fullness, team activity, lead quality.
  • A report is useless if it doesn’t lead to specific action. Before creating any metric, ask: what decision will I make based on it?
  • At the start, you need quick feedback (whether it sells at all, what objections arise), during growth – process stability (funnel, manager plans), during scaling – multidimensional analytics by teams, regions, products.

In the article below, you’ll see specific examples of reports for each growth stage, a checklist for implementing the system, and a list of what you should definitely throw out of your reporting. Read the full article 👇

As a company grows, the sales director’s tasks change dramatically. Today you personally close every deal and know all clients by name. Tomorrow you’re managing a team of ten people and trying to understand why targets aren’t being met. The day after, you’re coordinating three regional groups and thinking about strategy for the year ahead. At each stage, you need different reports because you’re solving different problems.

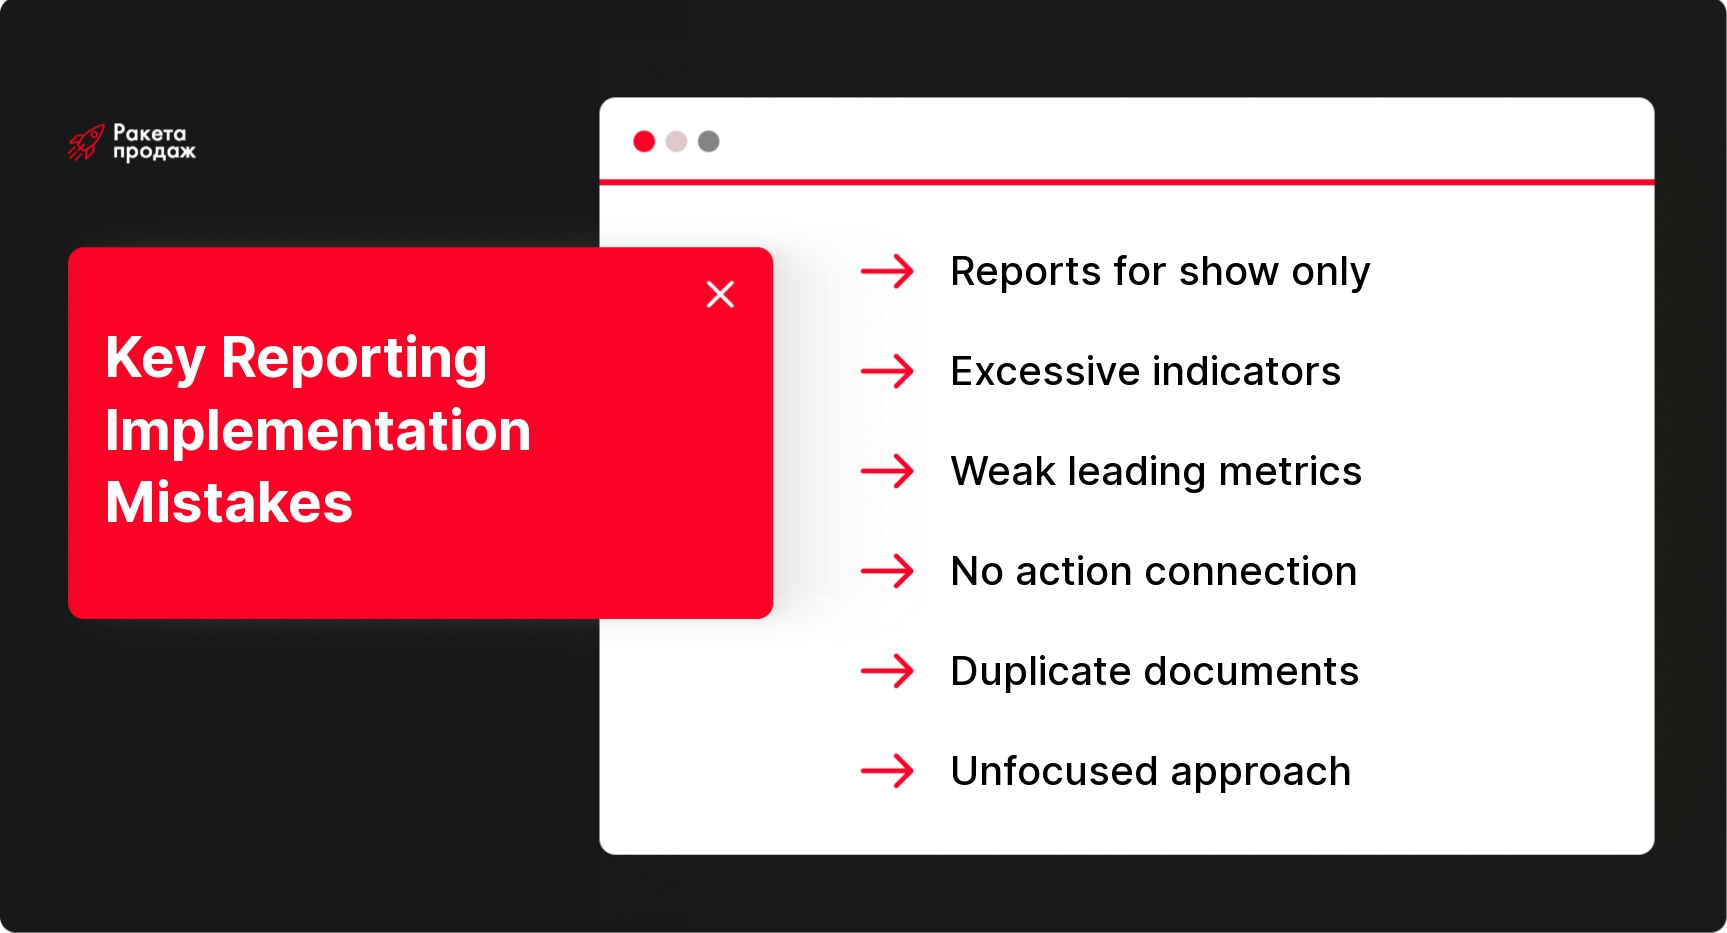
Excessive reporting kills sales just as effectively as a complete lack of it. When managers spend more time filling out tables than talking to clients, the system is broken. But when a leader can’t see the funnel and doesn’t understand where leads are being lost, that’s also a disaster. The main question isn’t how many reports to make, but which ones are needed here and now – what sales management reports are needed at a specific stage of business development.

In this article, you’ll get a practical system for building reporting for different growth stages. We’ll examine which metrics are critical at the start, what to add when scaling, and what you should definitely abandon. This isn’t theory for theory’s sake – only what works in real market conditions.

Why a Sales Director Needs Management Reporting

Let’s be clear right away: a sales department head report for the sake of reporting is a meaningless waste of time. If you’re creating a document only because “that’s how it’s done” or “the director demands it,” it won’t be useful. Management analytics is a completely different story. It’s a tool that answers specific questions: why didn’t we meet our targets, where are we losing clients, which managers need help, which products are selling best.

Good sales manager reporting allows you to make decisions quickly and accurately. You see that conversion at the demonstration stage has fallen from 40% to 25% – so the problem is in the product presentation or in lead quality. You notice the average check has decreased by 15% – time to review pricing strategy or look for upselling opportunities. You discover one manager is closing twice as many deals as the rest – study their approach and implement successful practices across the team.

The connection between reporting and the sales plan is direct and obvious. Reports for sales plan management aren’t just monitoring, but tools for achieving goals. A plan without reports is just a number in the air. You tell your team “we need to sell 2 million,” but don’t control progress and don’t see deviations until the end of the month. And when you do see them, it’s too late to change anything. The right reporting system shows dynamics every week: how much is closed, how much is in progress, how many potential deals are in the funnel, whether they’re enough to meet the plan.

Motivation is also built on transparency. When managers see their results compared to goals and colleagues, it stimulates healthy competition. But balance is important here: reporting for sales team control should show not only misses but also successes. A system that only punishes kills initiative. A system that acknowledges progress and provides tools for growth motivates forward movement.

Scaling without reports is fundamentally impossible. When you have three salespeople, you can keep all information in your head. When you have thirty – you can’t. Reports for scaling sales become critically important. You need to see the big picture: which regions are working better, which channels bring quality leads, where the bottlenecks are in the sales process. Without structured analytics, attempts to grow turn into chaos.

Typical mistakes start with excessive KPIs. When you track 25 indicators simultaneously, you’re tracking nothing. Focus becomes blurred, and the team doesn’t understand what’s truly important. The second mistake is lagging metrics. Looking only at last month’s revenue is like driving a car while looking in the rearview mirror. You need leading indicators: number of new leads, manager activity, funnel fullness. They show what will happen in a month or two and give time for correction.

Lack of focus kills effectiveness just as reliably as lack of data. If reports aren’t linked to specific actions, they’re useless. You see a problem – what’s next? Proper reports for the head of the sales department don’t just record facts, they suggest direction and help prioritize.

image

How Company Growth Stage Affects the Set of Reports

Companies don’t grow linearly, but in leaps. First, you’re in survival mode: testing hypotheses, looking for first clients, trying to understand if your product works at all. This is startup. Then comes the growth phase: you have a stable client flow, a team forms, repeatable processes appear. Next is scaling: you enter new regions or segments, build multiple sales teams, standardize everything possible. Finally, maturity: the company works like a well-oiled machine, focus shifts to optimization and maintaining positions.

At each stage, the questions you ask yourself as a leader are fundamentally different. At the start: “Are people willing to pay for our product?” During growth: “How can we meet targets consistently month after month?” During scaling: “How can we manage multiple teams and channels simultaneously?” In maturity: “How can we protect market share and increase efficiency?” Management reports during company growth should answer precisely these questions.

Why is a report useful at one stage harmful at another? Because it distracts attention from what’s truly important. Imagine you’re just starting and already building detailed analytics by client segments, regions, and channels. You have ten clients and you’re spending time on complex tables instead of looking for the eleventh. Or conversely: you have a hundred managers in five cities, but you continue looking only at total revenue, not understanding exactly where the system is sagging.

Key questions when selecting reports are always the same. First: what decision should I make based on this data? If there’s no answer – the report isn’t needed. Second: can I influence this indicator? If not – why track it? Third: how fresh should this data be? Some metrics make sense to look at weekly, others – daily. Fourth: who specifically will use this report and for what?

The connection between reporting and sales department manageability is direct. The more complex the structure, the more visibility you need, but not through data volume, rather through relevance. A small team needs a simple funnel and list of active deals. A large organization needs dashboards broken down by teams, regions, products – but each metric should be there not just for show, but because specific management decisions are made based on it.

Familiar with seeing numbers but not understanding which ones are truly critical for decision-making? According to our statistics, 70% of managers need only 5 key reports to fully control sales. At “Rocket Sales,” we help transform masses of data into simple but powerful management tools. Our comprehensive “Sales Department Systematization” service includes CRM setup, creating personalized reporting systems, and training your team to use these tools. We don’t just implement technology, but build a complete analytical system that clearly corresponds to your business development stage. Over 7+ years, we’ve built 158 effective sales departments in 14+ different niches, and our clients’ average revenue increase is +35%.

Get a transparent and manageable sales system that will grow with your business - order a free audit of your sales department's effectiveness!

The right evolution of reporting isn’t just adding new indicators as you grow. It’s transforming the approach from operational control to strategic management. First, you monitor managers’ work. Then, you ensure processes are effective. Next, you verify that strategy is delivering results. The tools are different at each level, but the principle is the same: reports for sales managers should help make better decisions faster.

Sales Director Reports at the Launch and First Sales Stage

At the very start, your main task is to understand if what you’re offering sells at all. Not theoretically, not in a business plan, but in practice. Are people willing to part with money for your product? If yes – how much are they willing to pay? What objections are most common? Who is your real client, not the one you imagined in your presentation? These questions are answered not by complex analytical systems, but by simple, regular observations.

The minimally sufficient set of reports at the launch stage fits into a few points. First: how many sales were made and for what amount. This is the basic metric of business existence. Second: where these clients came from. You don’t need detailed attribution across twenty channels – it’s enough to understand what worked: recommendation, advertising, cold calling, word of mouth. Third: what objections arise and at what stage clients drop off. This is qualitative information often ignored, but critically important for correcting your offer.

The focus should be on feedback speed, not detail. You don’t need a perfectly structured CRM with ten funnel stages and twenty mandatory fields. You need to quickly see patterns: what works, what doesn’t, where to go next. A simple list of deals with basic parameters (client, amount, source, status, key notes) provides more value than a complex system that nobody fills out because there’s no time.

If at this stage you’re just choosing how to record and track deals, you should familiarize yourself with the CRM system implementation approach, allowing you to build a sales accounting process and make initial analytics maximally simple and fast for the team.

Specific examples of reports for this stage look like this. Weekly report on new clients: a table with names, deal amounts, lead sources, and brief comments on what worked in each case. This helps see which attraction channels really convert to money. Objection journal: a simple list of questions and doubts salespeople face, and ways they managed to overcome them. Over time this will turn into scripts and a knowledge base, but at first it’s just collecting information.

Active funnel tracker: a list of all potential deals in progress with amount, closing probability, and next step. You don’t need complex stages – three statuses are enough: “first contact,” “discussing details,” “ready to close.” This gives understanding of how much money can potentially come in the near future and what to pay attention to right now. Simple conversion analysis: how many people you contacted, how many you sent proposals to, how many agreed to buy. Three figures showing the basic process efficiency.

For more on how to conduct sales funnel analysis even in small teams, check our article – it will help immediately understand where the main losses occur and how to minimize them even in early stages.

It’s critically important not to overload the system at this stage. Every minute spent filling out reports is a minute not spent finding the next client. The balance should tilt toward action, but with minimal recording of results for learning. Regularity is more important than detail: it’s better to look at five simple indicators every week than to analyze twenty complex ones once a month.

Another important point is recording qualitative information beyond numbers. What phrases engage clients? Which product use examples spark interest? Which segments respond better than others? These insights don’t always fit into tables, but they determine success in subsequent stages. Make a habit of writing brief notes after each significant conversation with a client – it will pay off a hundredfold when you start scaling.

Sales Director Reporting at the Active Growth Stage

When you’ve proven the product sells and started increasing turnover, the focus shifts. Now the question isn’t “can we sell,” but “how to do it consistently and predictably.” You have a team, albeit small, and you need to manage not just deals, but people. This fundamentally changes reporting requirements. Reports for sales management become more structured and regular.

Team growth requires process standardization. When you alone handle sales, you can work intuitively. When the team has five to ten people, each with their own understanding of “how it’s done,” chaos begins. Reports become tools that ensure a unified approach: everyone fills out the same fields, goes through the same stages, follows common client qualification criteria. This isn’t bureaucracy for bureaucracy’s sake – it’s a necessity for scaling.

The role of strategic sales reports in controlling scaling is critical. You add a new person to the team – how do you know they’re working effectively? You launch a new attraction channel – how do you assess its profitability? You change pricing – how does this affect conversion? Without structured data, you’re making decisions blindly. With the right reports, you see the real picture and correct course before problems become critical.

Specific examples of reports for the growth stage include the following. Sales funnel with detail by stages: how many leads at each stage, what conversion between stages, where the main losses occur. This is a classic tool showing bottlenecks in the process. If you see 50% of clients dropping off after the first meeting, the problem is in the presentation or lead qualification quality. If conversion sags at the deal closing stage, perhaps managers don’t know how to handle objections or the price is too high.

Report on plan fulfillment by each manager: who closed how many deals, what amount, what percentage of quota. This gives understanding of who’s pulling the team, who’s consistently average, and who needs help. It’s important to look not just at the final figure, but at dynamics: if someone hasn’t met their plan three months in a row, it’s a signal for conversation and possibly changes. For more on standards and nuances of such reports, check our material on sales department KPIs, which compiles best practices for evaluating performance and building an honest motivation system.

Lead source analysis with calculation of attraction cost and conversion: which channels provide the most inquiries, how much a lead costs from each source, what percentage converts to clients. This is the basis for marketing budget allocation.

Manager activity report: how many calls, meetings, proposals sent. It’s important not to slip into micromanagement here. Activity itself isn’t the goal – but if you see someone has few results and also low activity, this indicates a problem with motivation or understanding of tasks. If activity is high but results aren’t – the problem is with work quality, coaching is needed. Weekly forecast of plan fulfillment: how many deals in progress, their total value, considering closing probability is this enough for the month’s plan. This is a leading indicator giving time for correction.

Deal cycle length analysis: how long on average it takes from first contact to closing, how this is distributed across different client types or products. Understanding the cycle is critically important for forecasting and planning. If you know the average deal closes in 45 days, you can more accurately plan cash flow and team workload. Report on repeat sales and upsells: how many existing clients bought again or expanded their purchase. This is especially relevant for markets where focus shifts from aggressive growth to retention and maximizing client value.

At this stage, individual differences in manager effectiveness begin to show. Evaluating manager effectiveness becomes a key element: you need to see the effort structure of each employee, identify and scale best practices across the team, and make decisions about additional training or team composition changes based on objective data.

Which reports a sales manager needs at this growth stage helps see this and work with it systematically: use the best as benchmarks for training others, develop the average through targeted coaching, either work intensively with underperformers or decide to replace them.

Management Reports When Scaling Sales

Scaling is the moment when one team becomes several, one product is supplemented by others, one region expands to three to five. Management complexity grows exponentially. You can no longer keep all details in your head, can’t personally control every deal. You need a system giving visibility at all levels simultaneously. Reports for sales managers become an integral part of management.

Growth in teams, channels, and products requires multidimensional analytics. Knowing total revenue isn’t enough – you need to see how each direction works separately and in connection with others. Which region is growing faster? Which product provides more margin? Which team is more effective? Which acquisition channel pays off better? Answers to these questions determine strategic decisions about resource allocation.

Reports for the head of the sales department become an obvious requirement. If previously you focused on tactical details (why this specific deal didn’t close), now you need a picture at the level of trends and patterns. Is the average check growing overall? Is the client profile changing? Which segments show the greatest growth potential? These questions require aggregated data and the ability to see the forest for the trees.

The transition from manual management to systemic means automating routine. You physically cannot manually collect reports from five team leaders, consolidate them, analyze and draw conclusions. You need tools that automatically collect data, visualize it in an understandable way and allow quickly finding anomalies. CRM systems integrated with BI platforms become not a luxury but a necessity.

Examples of reports for the scaling stage include the following. Team dashboard: a comparative panel showing key metrics (revenue, number of deals, conversion, average check) for each team. This allows quickly seeing where everything is good and where intervention is needed. Product mix analysis: which products sell more often, which provide more revenue, which have better margins, how the sales structure changes over time. This is the basis for decisions about where to invest in product line development.

Report by regions or segments: breakdown of all key metrics by geography or client types. For markets where regions differ greatly in purchasing power and preferences, this is critically important. The capital may show completely different dynamics than western regions, and strategies should account for these differences. Client cohort analysis: how groups of clients attracted in different periods behave. How many make repeat purchases, how quickly their value grows, what is the churn dynamic. This helps evaluate long-term marketing and sales effectiveness.

Quarterly revenue forecast with breakdown by directions: an aggregated forecast showing expected revenue considering the current funnel, historical conversions, and seasonality. This is a tool for financial planning and strategic decision-making. Acquisition channel effectiveness analysis with full economics: customer acquisition cost (CAC), lifetime value (LTV), LTV to CAC ratio, investment payback period for each channel. This allows optimizing the marketing budget and focusing on the most profitable sources.

Manager effectiveness report with detailed metrics: not just “who sold how much,” but deep analysis of each person’s work quality. Conversion at different funnel stages, average deal size, cycle length, number of repeat sales to existing clients. This enables personalized development of each team member. Accounts receivable monitoring: for markets where payment delays are common, it’s critically important to track not just the fact of sale, but actual money receipt. A report on payment terms, overdue payments, collection effectiveness becomes an integral part of the system.

At this stage, you start using predictive analytics: models that predict deal closing probability based on multiple factors, algorithms determining optimal time for the next client contact, systems automatically scoring leads by potential. This is no longer just reporting – it’s data-driven management in the fullest sense.

What Reports a Sales Director Doesn't Need

Understanding what to abandon is often more important than understanding what to add. Useless and harmful reports eat up team time, distract attention from what’s important, and create an illusion of management instead of real control. Let’s examine specific examples of what should definitely be removed from the reporting system.

The first candidate for removal – reports nobody reads or uses for decision-making. If a document is created “for show” and sent to the archive without causing any reaction, it’s useless. Check: when was the last time any action was taken based on this report? If you can’t remember – delete it boldly. Team time is more valuable.

The second type of harmful reports – those focused exclusively on activity without connection to results. Number of calls, emails sent, meetings held makes sense only in the context of conversion. A report showing a manager made 200 calls in a week but not showing how many led to deals provokes wrong behavior. People start chasing quantity for the indicator’s sake, forgetting about quality.

The third category – excessively detailed reports requiring hours to prepare but providing no new insights. For example, breaking down sales by 50 client characteristics when really only three or four matter. Or daily reports on indicators that change slowly and make sense to look at weekly. Detailing should be justified by specific decisions you make based on it.

The fourth kind of unnecessary reports – those duplicating each other. When the same information is presented in three different formats for different recipients, it’s a sign of a poorly built system. One source of truth, customizable for different roles through filters and views, is more effective than multiple versions of the same data.

Excessive reporting reduces sales through several mechanisms. First, it takes time that could be spent on clients. Research shows salespeople spend up to 30% of work time on administrative tasks instead of selling. Every hour spent filling useless forms is an hour without contact with potential buyers. Second, excessive reporting demotivates. When people feel they’re being controlled for control’s sake, not to help achieve results, enthusiasm drops.

Third, an abundance of metrics blurs focus. When a manager has ten equally prioritized indicators, they don’t know what to focus on first. An effective system highlights two or three critical metrics for each role and makes them absolutely transparent. The rest is supporting information available when needed but not requiring daily attention.

How to understand a report should be removed? Ask three questions. First: has anything changed in the work based on this report in the last month? If not – most likely it’s not needed. Second: how much time goes into preparing this report and is this investment justified by insight value? If the ratio is clearly not in favor of usefulness – the report is a candidate for removal. Third: can the same information be obtained more simply or automatically? If yes – replace the manual process with an automatic one or abandon the report altogether.

Regular audit of the reporting system should be the norm. Review all regular reports quarterly: what’s relevant, what’s outdated, what can be simplified. Business changes, and management tools should change with it. What was critical six months ago may be unimportant today. Flexibility and willingness to abandon the familiar for effectiveness is a sign of mature management.

How to Build a Reporting System for a Sales Director

Building an effective reporting system starts with understanding principles, not choosing tools. First principle: reports for sales managers should answer specific business questions. Before creating any new report, formulate what decision you’ll make based on it. If there’s no clear answer – the report isn’t needed. Second principle: less is more. Five relevant metrics are better than twenty-five diverse indicators.

Third principle: balance between leading and lagging indicators. Revenue and number of closed deals show the past. Funnel fullness and team activity predict the future. You need both types of metrics for a complete picture. Fourth principle: transparency and accessibility. Data should be available to those who need it, in real time or close to it. A report that takes a week to create and arrives late loses most of its value.

The connection of reports to business goals is critical. Start with the company’s strategic goals for the year or quarter. What specifically needs to be achieved? Entering a new market? Increasing average check? Reducing client churn? For each goal, determine key metrics that will show progress. Then decompose these metrics to the level of teams and individual managers. Everyone should understand how their personal indicators connect to the company’s overall goals.

Reporting regularity is determined by the speed of changes and importance of the metric. Daily dashboards make sense for critical indicators in a rapidly changing environment. Weekly reports for sales management are standard for operational management. Monthly and quarterly reports are for strategic analysis and planning. Don’t make reports daily for slowly changing indicators – it’s a waste of time.

Responsibility for data should be clearly distributed. Who enters information into the system? When should this be done? Who checks data quality? Who analyzes reports and makes decisions? Without clarity on these questions, the system will fall apart. Data quality culture is formed from the top: if the leader demonstrates making decisions based on reports, the team will take them seriously.

Information presentation format matters. Visualization – graphs, diagrams, color coding – makes data more understandable and facilitates identifying trends. But don’t overload reports with decorations for decoration’s sake. Each visualization element should carry meaning. Interactive dashboards allowing detail with a click are more effective than static tables.

The checklist for implementing a reporting system looks like this. First: define goals and key questions the system should answer. Second: choose a minimal set of metrics to track at the current company development stage. Third: select tools matching your budget and team technical capabilities. Fourth: set up data collection processes and distribute responsibility.

Fifth: create simple, understandable dashboards for different roles (regular managers see their personal indicators, team leaders see their units’ results, top management sees the overall picture). Sixth: train the team: explain why each metric is needed and how it affects the overall result. Seventh: launch the system in pilot mode, collect feedback, adjust. Eighth: establish regular system review points (quarterly minimum) to adapt to changing needs.

Important point: the reporting system should develop gradually. Don’t try to implement all possible metrics and reports from day one. Start with the most necessary, let the team get used to it, see the benefit. Then add new elements as the company grows and tasks become more complex. An evolutionary approach is more effective than revolutionary.

A proper reporting system isn’t just tables with numbers, but a precise management tool that changes along with your business. But implementing such a system requires deep understanding of your sales funnel, processes, and which metrics are truly important at your stage. “Rocket Sales” offers a comprehensive solution to this issue. Our experts will conduct a detailed audit of current processes, help properly set up CRM, and develop a custom reporting system for management that will accurately reflect your business’s key metrics. We not only create tools but also teach your team to use them effectively. Our approach guarantees increasing client turnover by an average of 35%, and in some cases up to 86% conversion improvement. Among our partners are companies like Mitsubishi, Yamaha, and Naftogaz, confirming the effectiveness of our methods for businesses of different scales.

Transform your sales department into a predictable system with clear, measurable results - order comprehensive implementation of a reporting system today!

Conclusions

The journey from startup to mature company requires fundamentally different approaches to reporting at each stage. At the start, you need quick feedback and minimal data to test hypotheses: does it sell at all, who’s buying, what objections arise. During growth, focus shifts to stability and predictability: sales funnel, manager plan fulfillment, channel effectiveness. During scaling, multidimensional analytics is added: comparing teams, regions, products, client cohort analysis. At each stage, reports useful yesterday may become a burden today if not reviewed in time.

The key thought of this article is simple: sales management reports should help make decisions, not serve as an end in themselves. Each metric you track should answer a specific business question and lead to specific actions. If a report doesn’t change your behavior and doesn’t affect strategy, it’s useless. Fewer metrics, but relevant ones, are better than lots of data without focus.

For sales directors, the recommendation is: start small, but do it regularly. A simple funnel and list of active deals, updated weekly, will provide more value than a complex system implemented over six months but unused. As you grow, add new layers of analytics, but always ask yourself: what will I do differently knowing this information? If there’s no answer – the metric is superfluous.

For business owners, the advice is: invest in a culture of data-driven decision-making. This means not just demanding reports from the team, but demonstrating yourself how you use these reports for strategic decisions. Allocate resources for tools and training, but don’t impose excessive bureaucracy. The best reporting system is one the team uses voluntarily because they see it as help, not control for control’s sake.

Adapt global practices to your specific context. Consider market specifics: payment delays require monitoring accounts receivable, high price sensitivity of clients – analyzing average check dynamics, transition from growth to stability – focus on client retention and maximizing their value. Tools are universal, but application must be locally relevant.

And lastly: the reporting system is a living organism that should evolve with the company. Regularly review what works and what’s outdated. Don’t be afraid to abandon the familiar if it no longer serves the goals. Flexibility and focus on results are more important than formally following once-established rules.

In this article:
See more
Book a FREE sales funnel audit
CONTACT US
FAQ
What reports does a sales director need first and foremost?

First and foremost, a simple sales funnel showing the number of leads at each stage and conversion between these stages. The second critical report is sales plan fulfillment by each manager broken down by weeks. The third is a forecast for the current month based on active deals in progress. These three reports for sales management provide basic process visibility and allow responding promptly to problems.

Is it possible to manage a sales department without reports?

Technically yes, but only in a very small company where the leader personally participates in every deal and keeps all information in their head. As soon as the team grows to even five people, management without structured data turns into chaos. You lose control of the funnel, don’t see problems in time, make decisions based on intuition instead of facts. Reporting for sales team control isn’t bureaucracy, it’s a tool for visibility and control.

What reports for sales managers are considered basic at any growth stage?

Three reports remain relevant always, just their detail changes. First – sales funnel: simple at the start, with detail by managers during growth, with breakdown by teams and products during scaling. Second – revenue dynamics: absolute figures and plan fulfillment percentage. Third – client sources and their effectiveness: where leads come from, how many convert, what’s the economics of each channel. These three pillars support sales management at any complexity level.

How does sales manager reporting change as the company grows?

As it grows, reporting evolves from operational to strategic. At the start, you look at each deal individually; during growth – at team aggregate indicators; during scaling – at comparative effectiveness of different directions. New dimensions are added: client segmentation, product mix analysis, regional differences, cohort analytics. The role of automation and predictive models grows. But the principle remains the same: reports for the head of the sales department should answer current business questions and help make better decisions.

SUBSCRIBE TO MY TELEGRAM CHANNEL
The most valuable sales information right on your phone!
icon

LOTS OF USEFUL INFORMATION, FREE TEMPLATES, AND CHECKLISTS ON MY INSTAGRAM

Materials and practical advice on sales growth in our blog: